It’s easy to choose an infographic format or type that works for you. But keep in mind that the infographic should not be about you nor your brand or topic.
Designing a specific type of infographic because it’s more convenient on your end should never be the goal. It boils down to providing much value to your target audience.
After all, there’s no point reaching out to millions when your message doesn’t even resonate with them. Think value over volume. The question you should be asking is “What’s in it for your target audience and readers?”
10 infographic design formats for inspiration
With that said, here are 10 infographic formats with examples that you can refer to when you’re feeling uninspired with your infographic project.
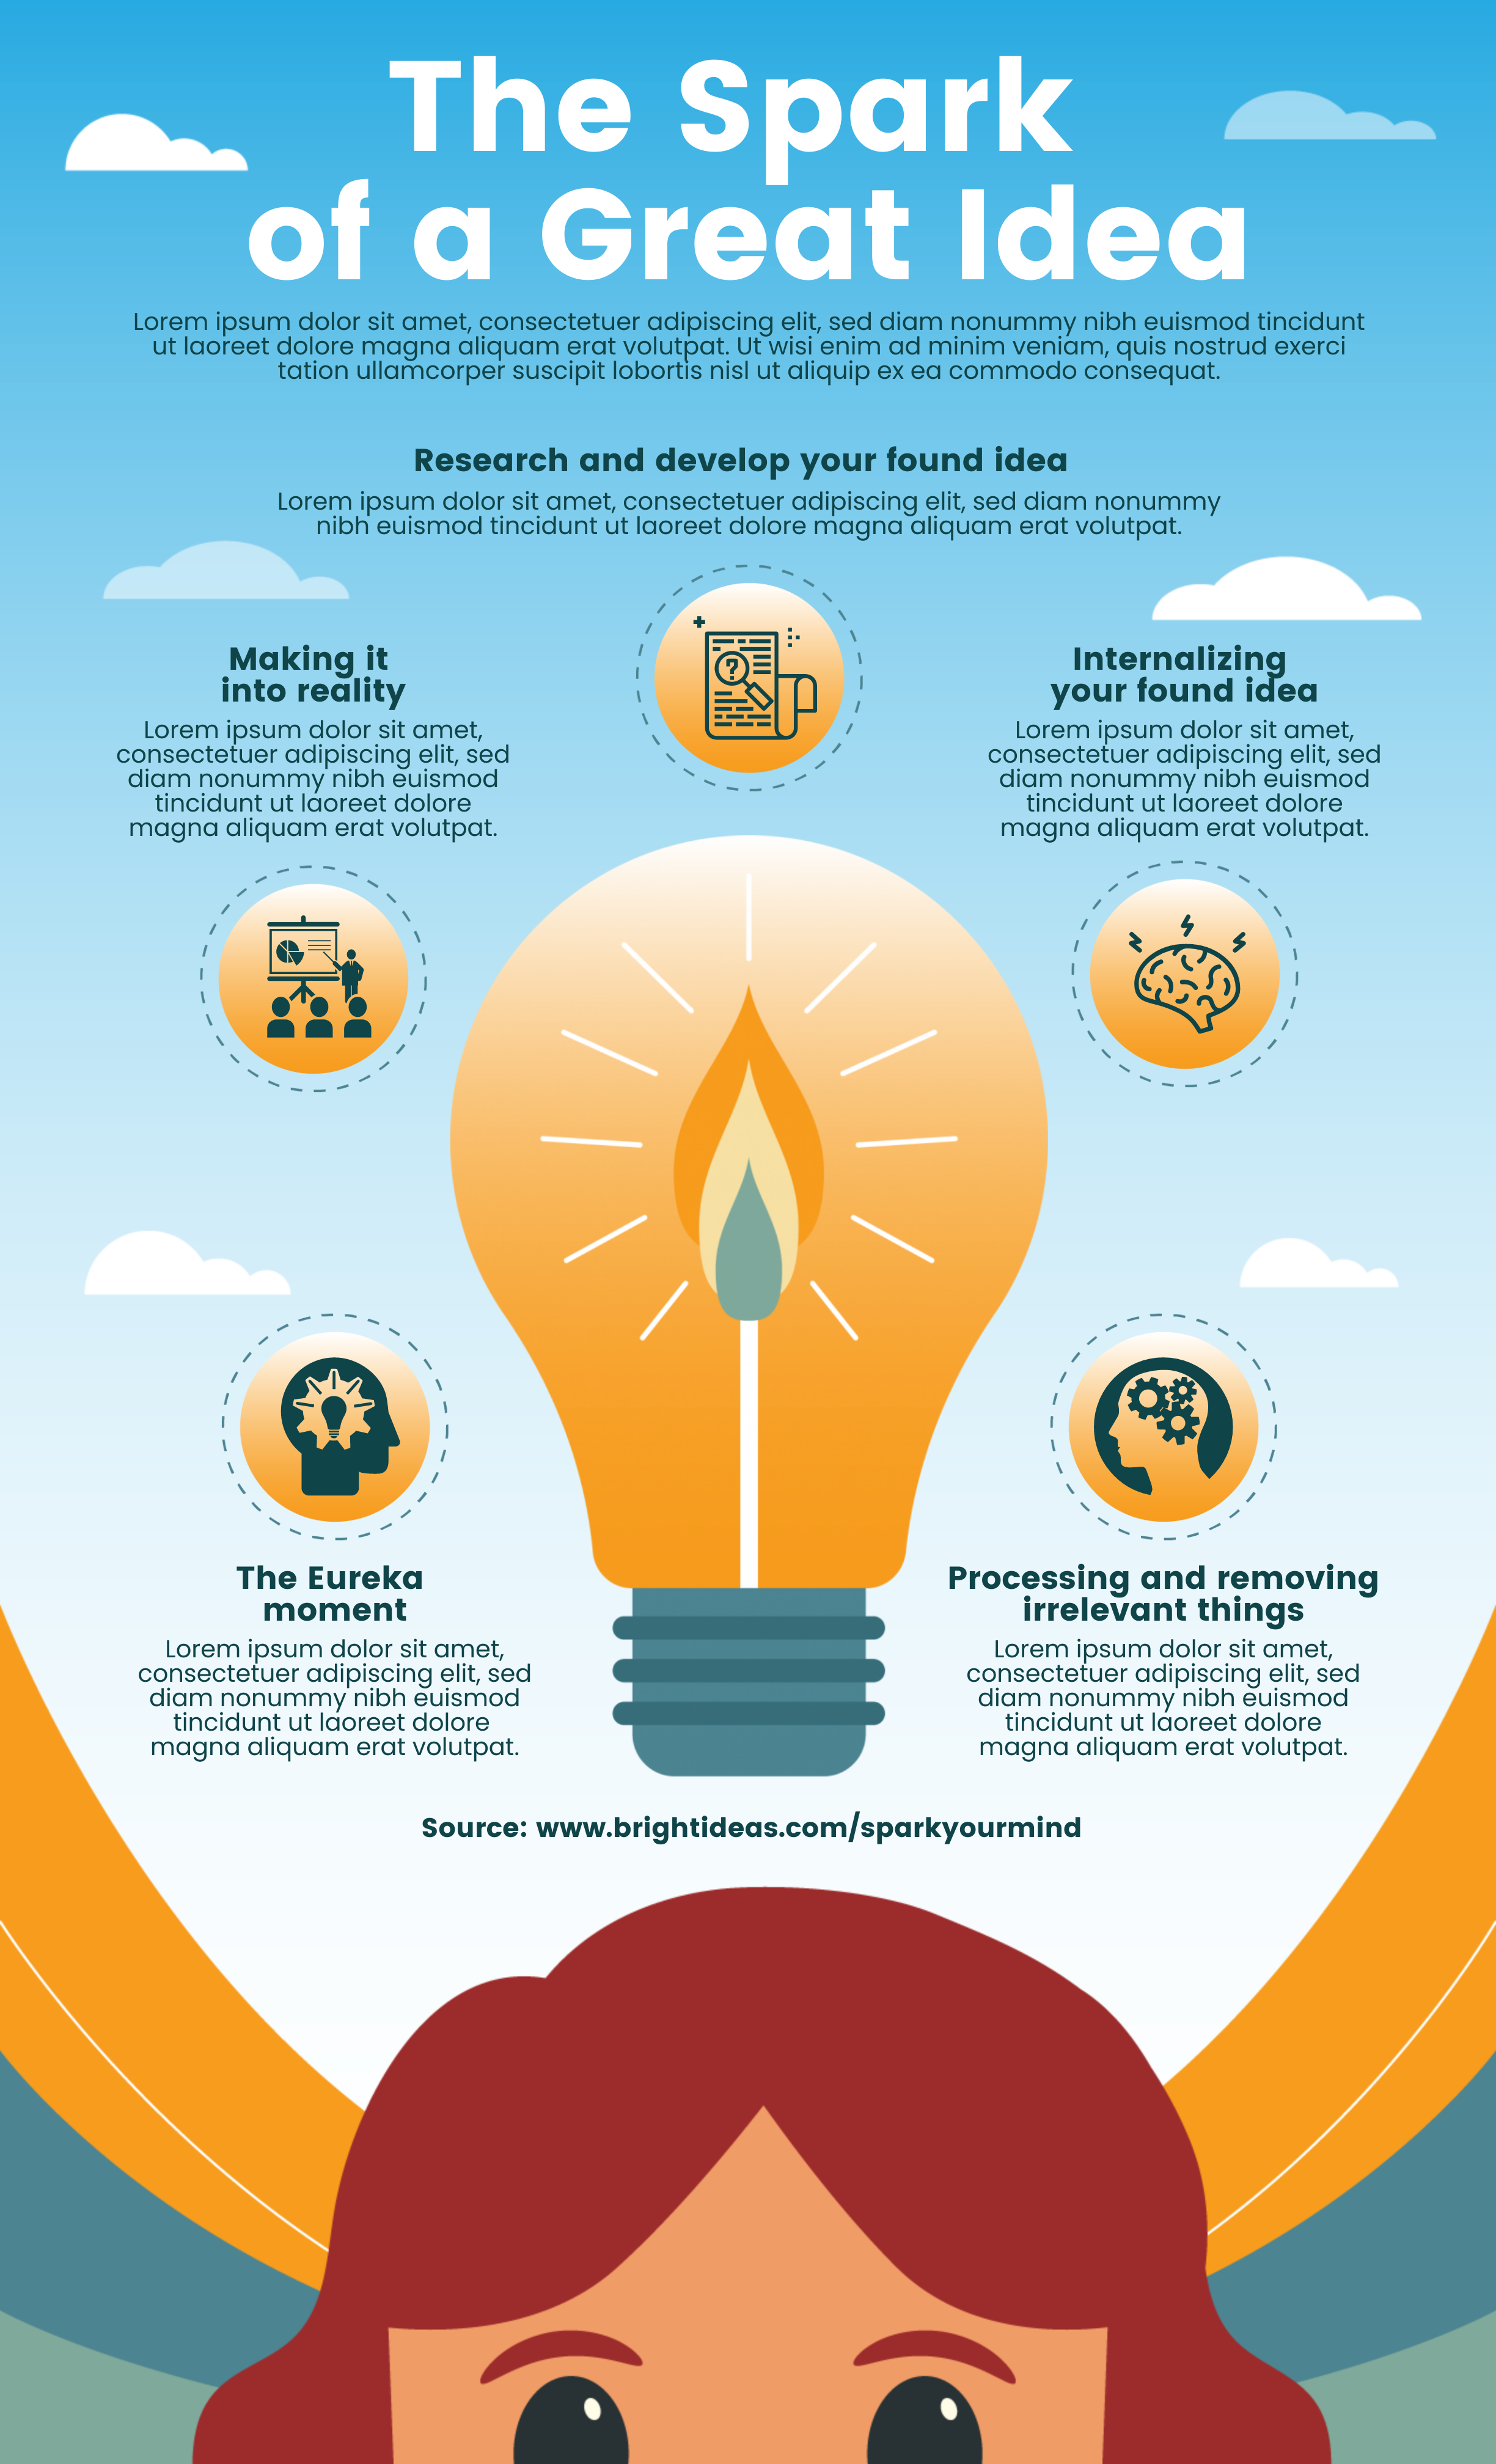
1. Visual infographic
This infographic format makes a piece of writing or boring report more visual.
When to use:
- You need to cut down on text
- You want to make a plain article more interesting
- You’d like to increase the sharing potential of your infographic
Example:
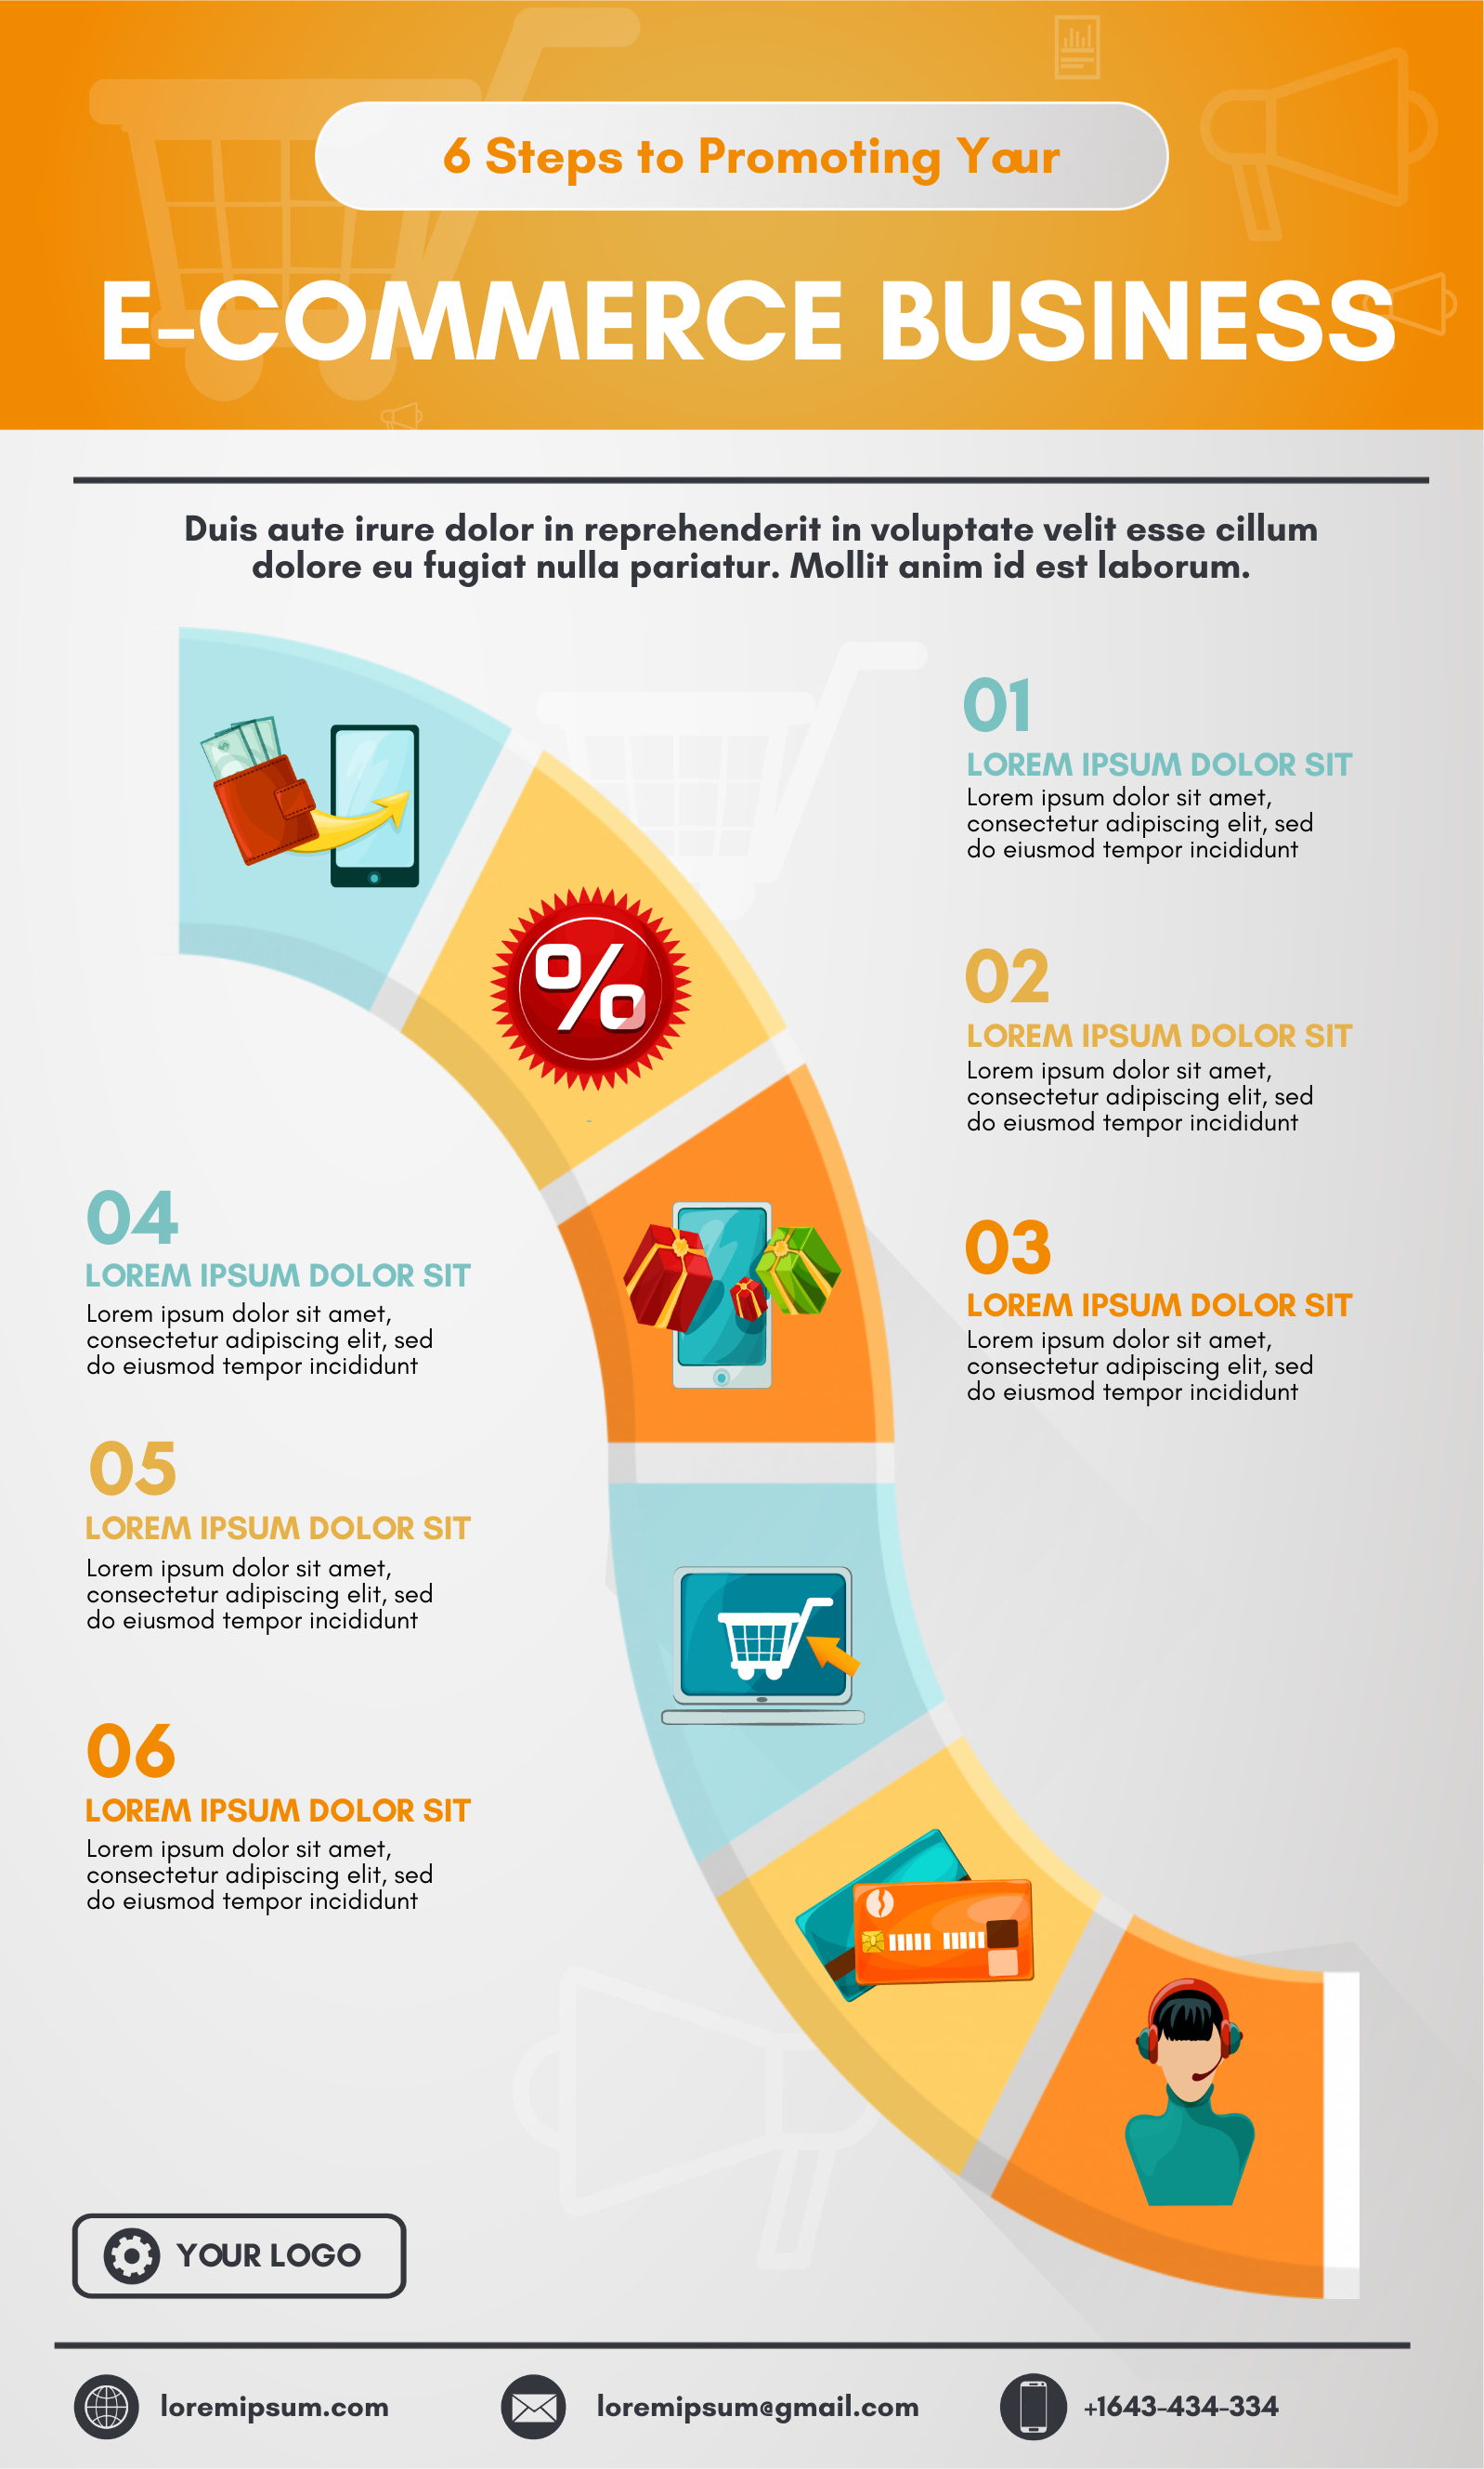
2. List-based infographic
If you want to support a claim through a series of steps, the list-based infographic format is a good option.
When to use:
- support a specific claim or argument
Example:
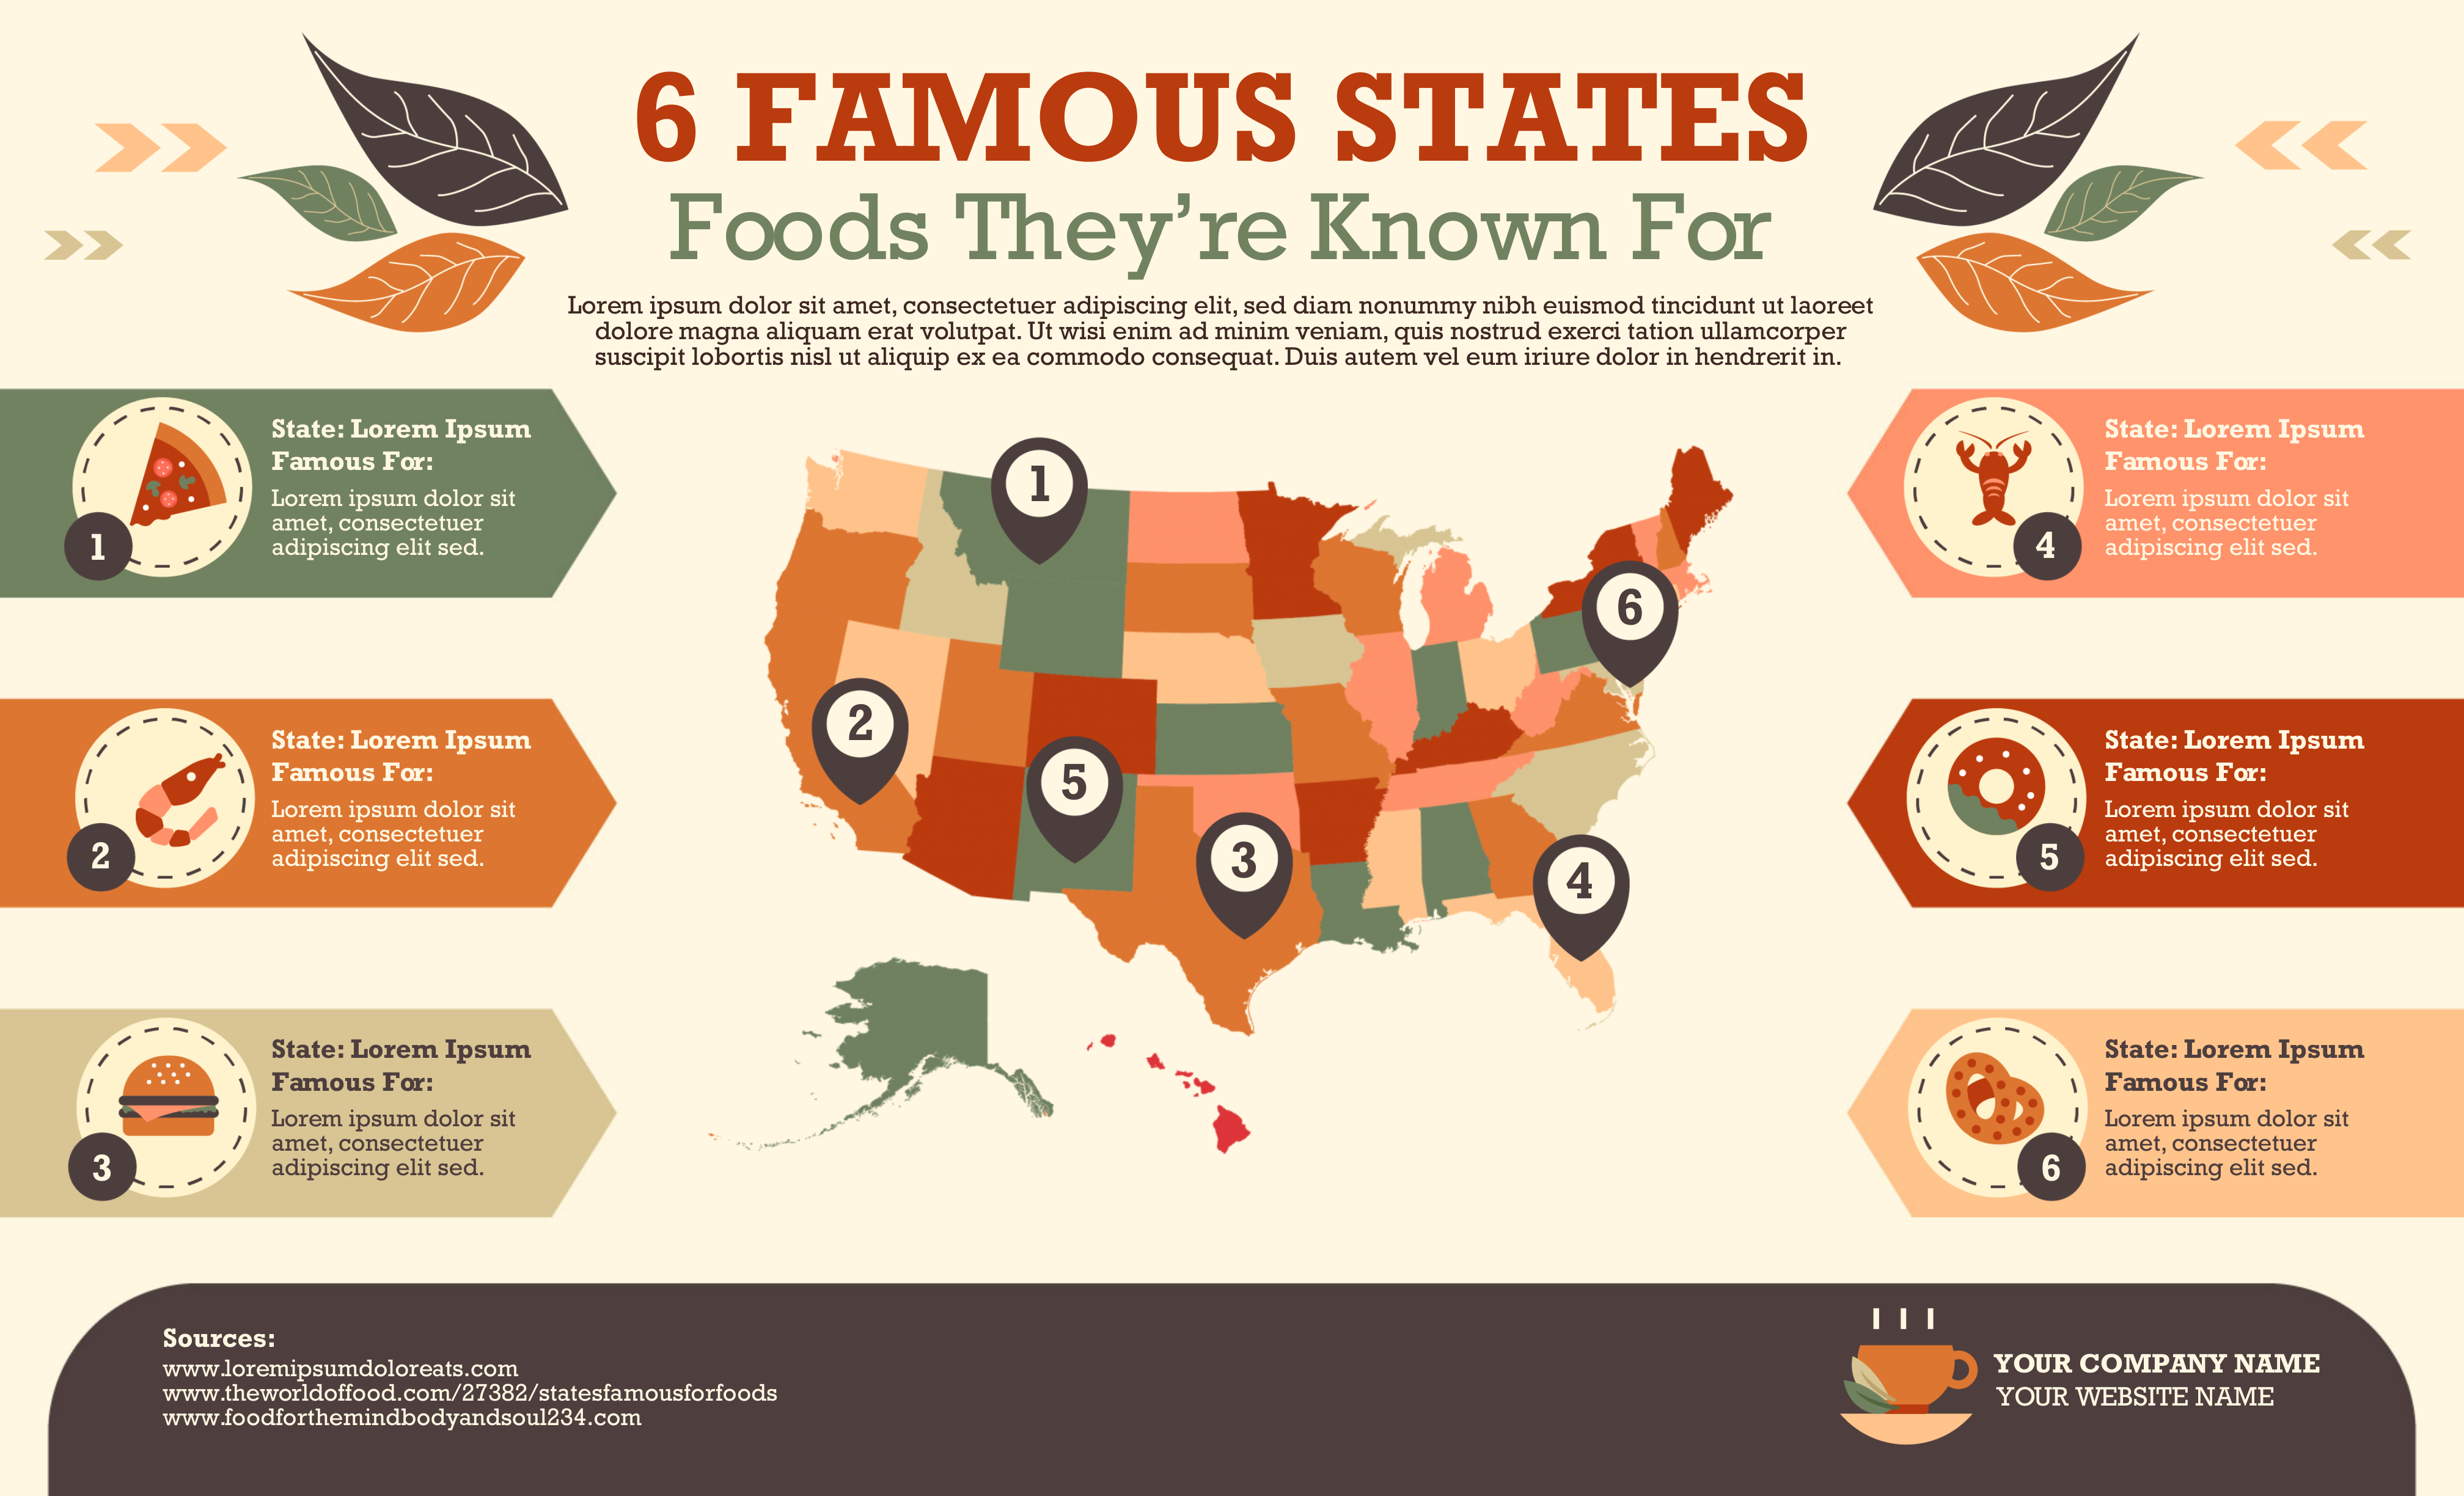
3. Map infographic
The map infographic format is ideal for presenting and sharing data trends based on location
When to use:
* compare places and cultures using location-centric data
Example:
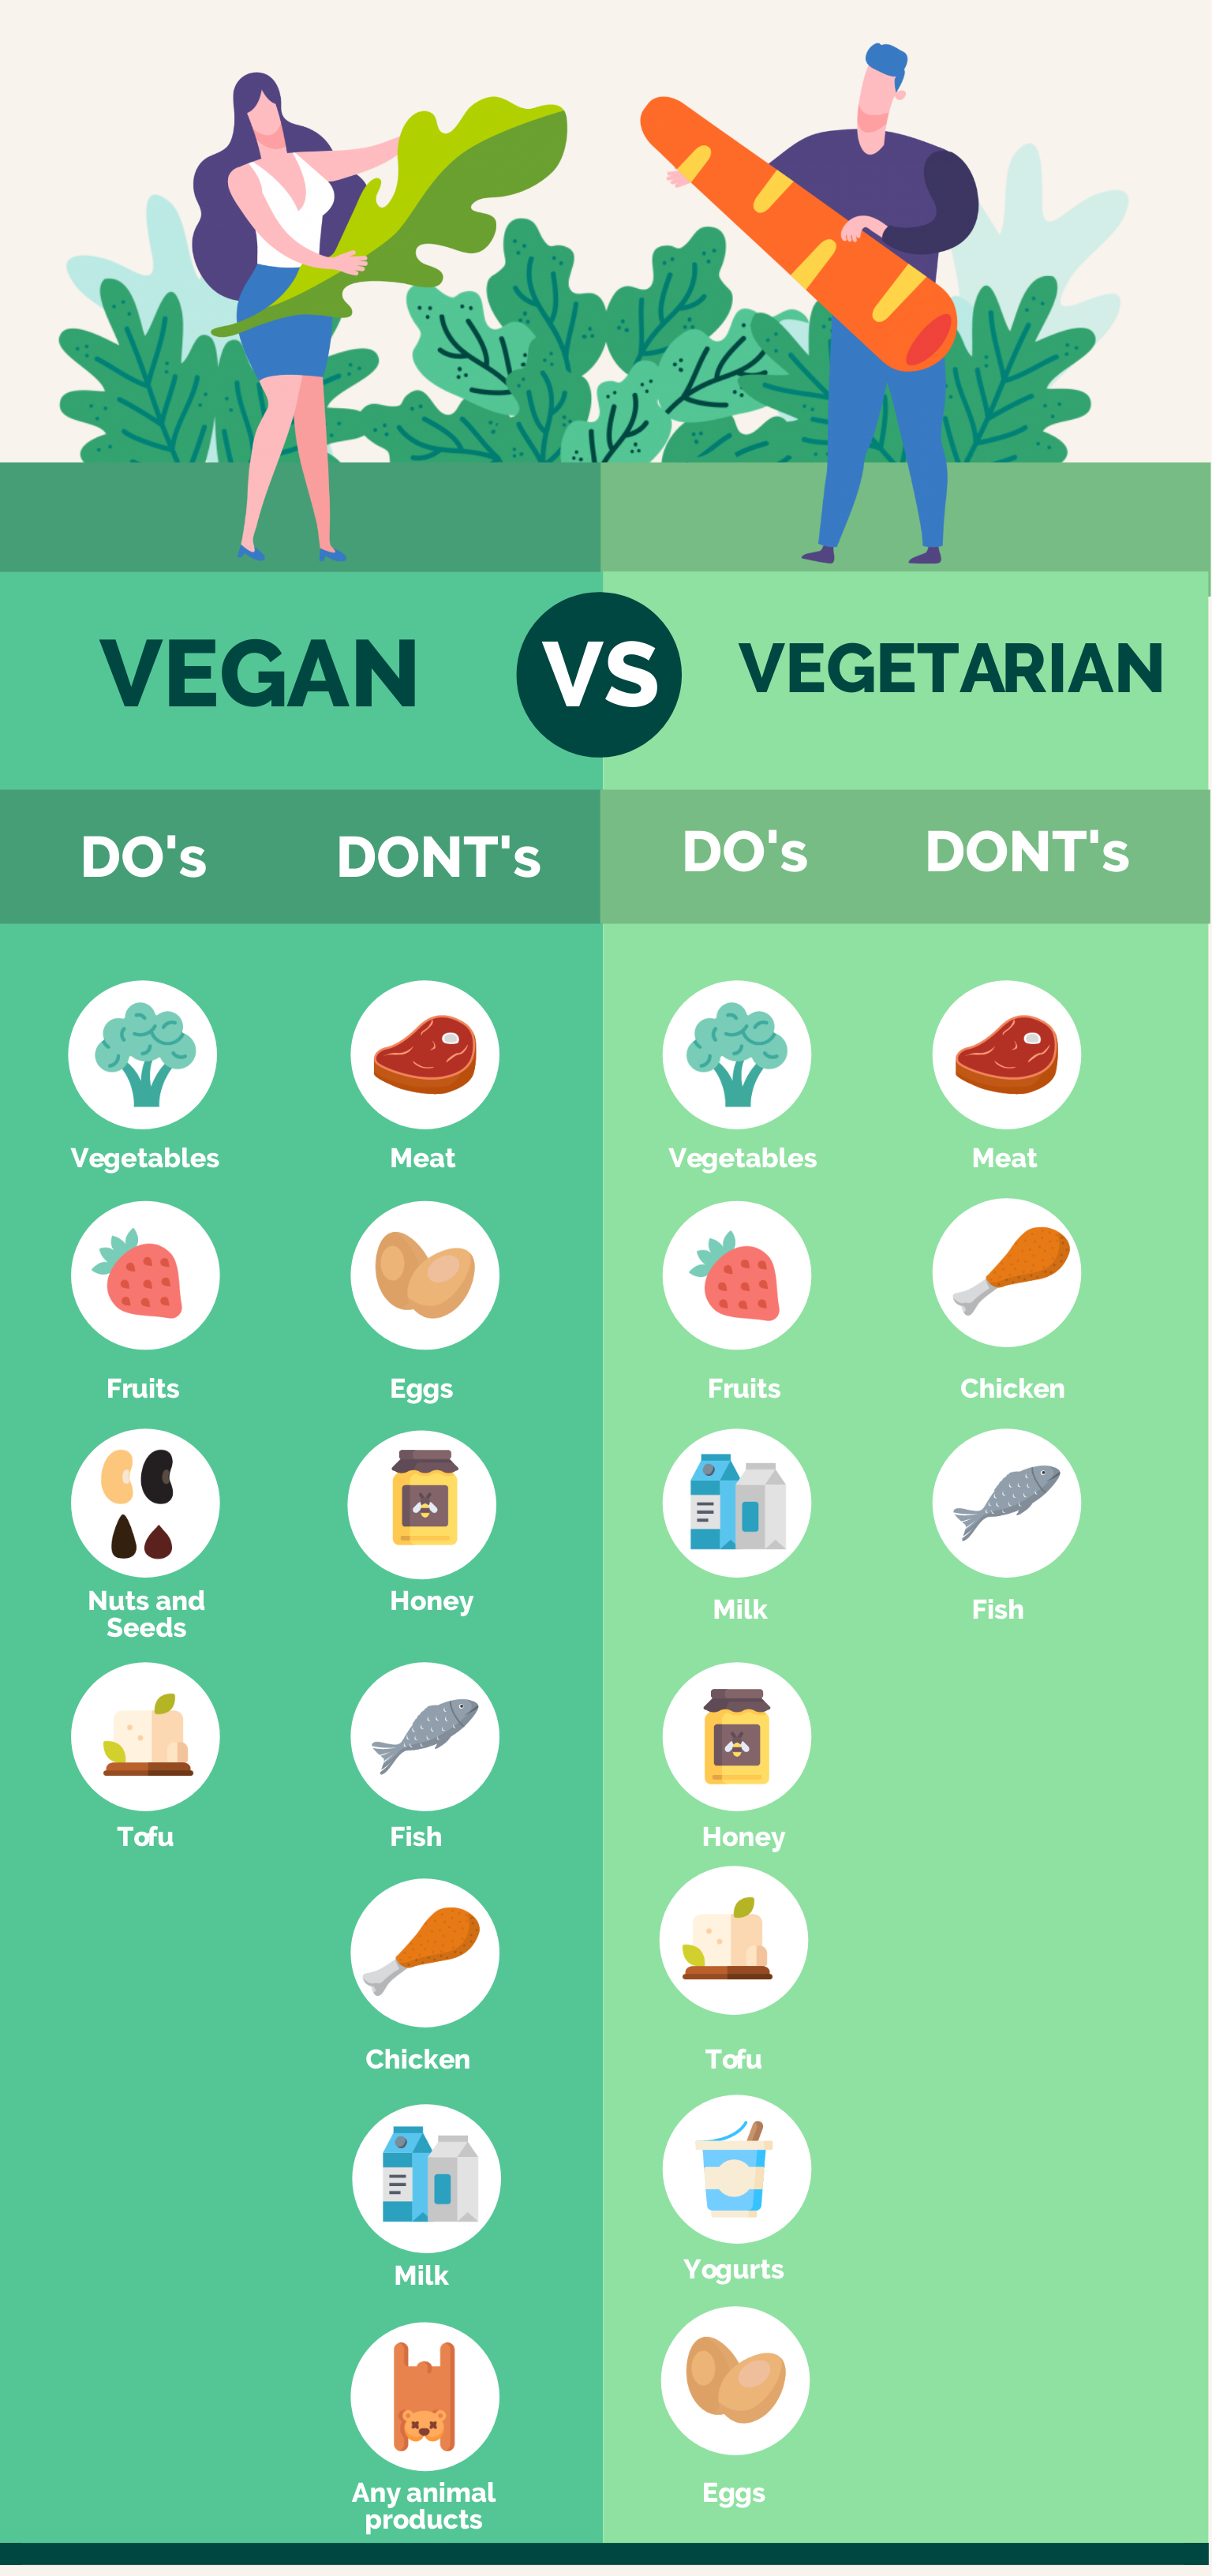
4. Versus or comparison infographic
The comparison infographic format compares two ideas, concepts, or objects.
When to use:
* highlight differences between two similar things
* highlight similarities between two unlike things
* prove one option is superior/inferior to the other
Example:
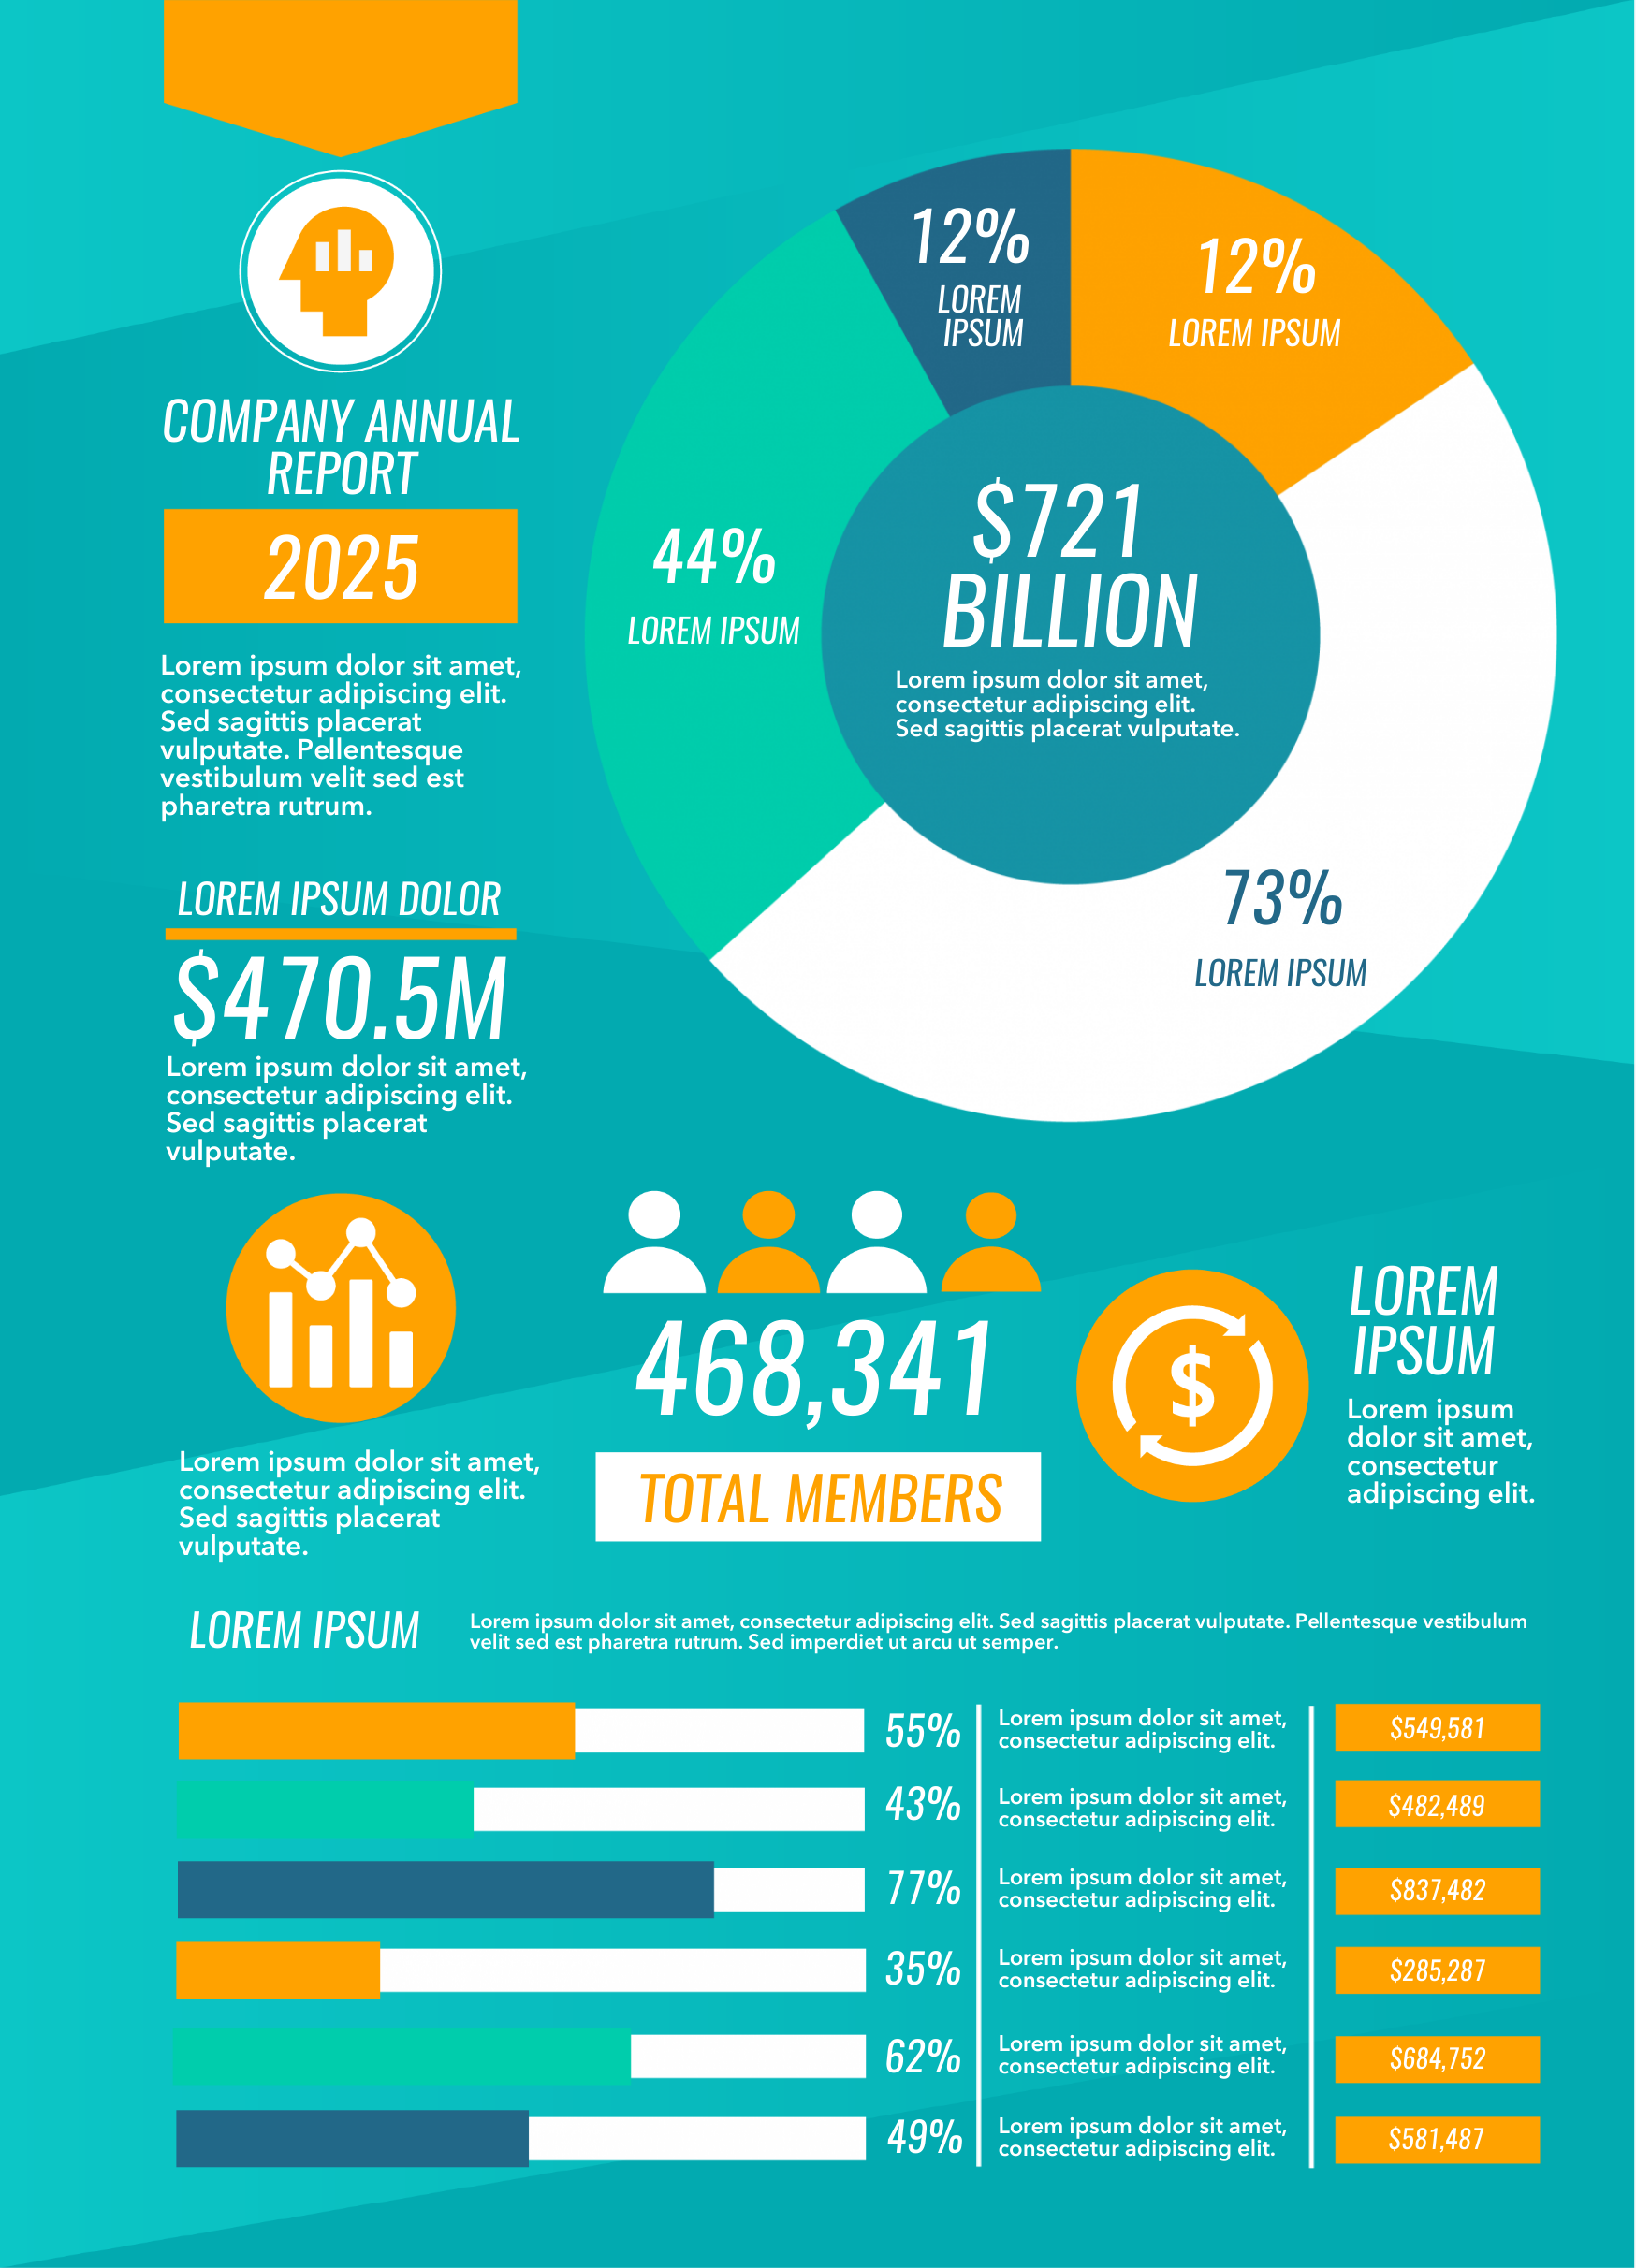
5. Data visualization or statistical infographic
Data visualization is ideal in illustrating complex data and information through charts, graphs, and/or design.
When to use:
- make data-driven arguments easier to understand
- make facts and statistics more interesting to absorb
Example:
6. Flowchart infographic
A flowchart infographic offers specialized answers to a question via reader choices
When to Use:
- provide personalized answers for readers
- showcase how multiple situations can reach the same conclusion
Example:
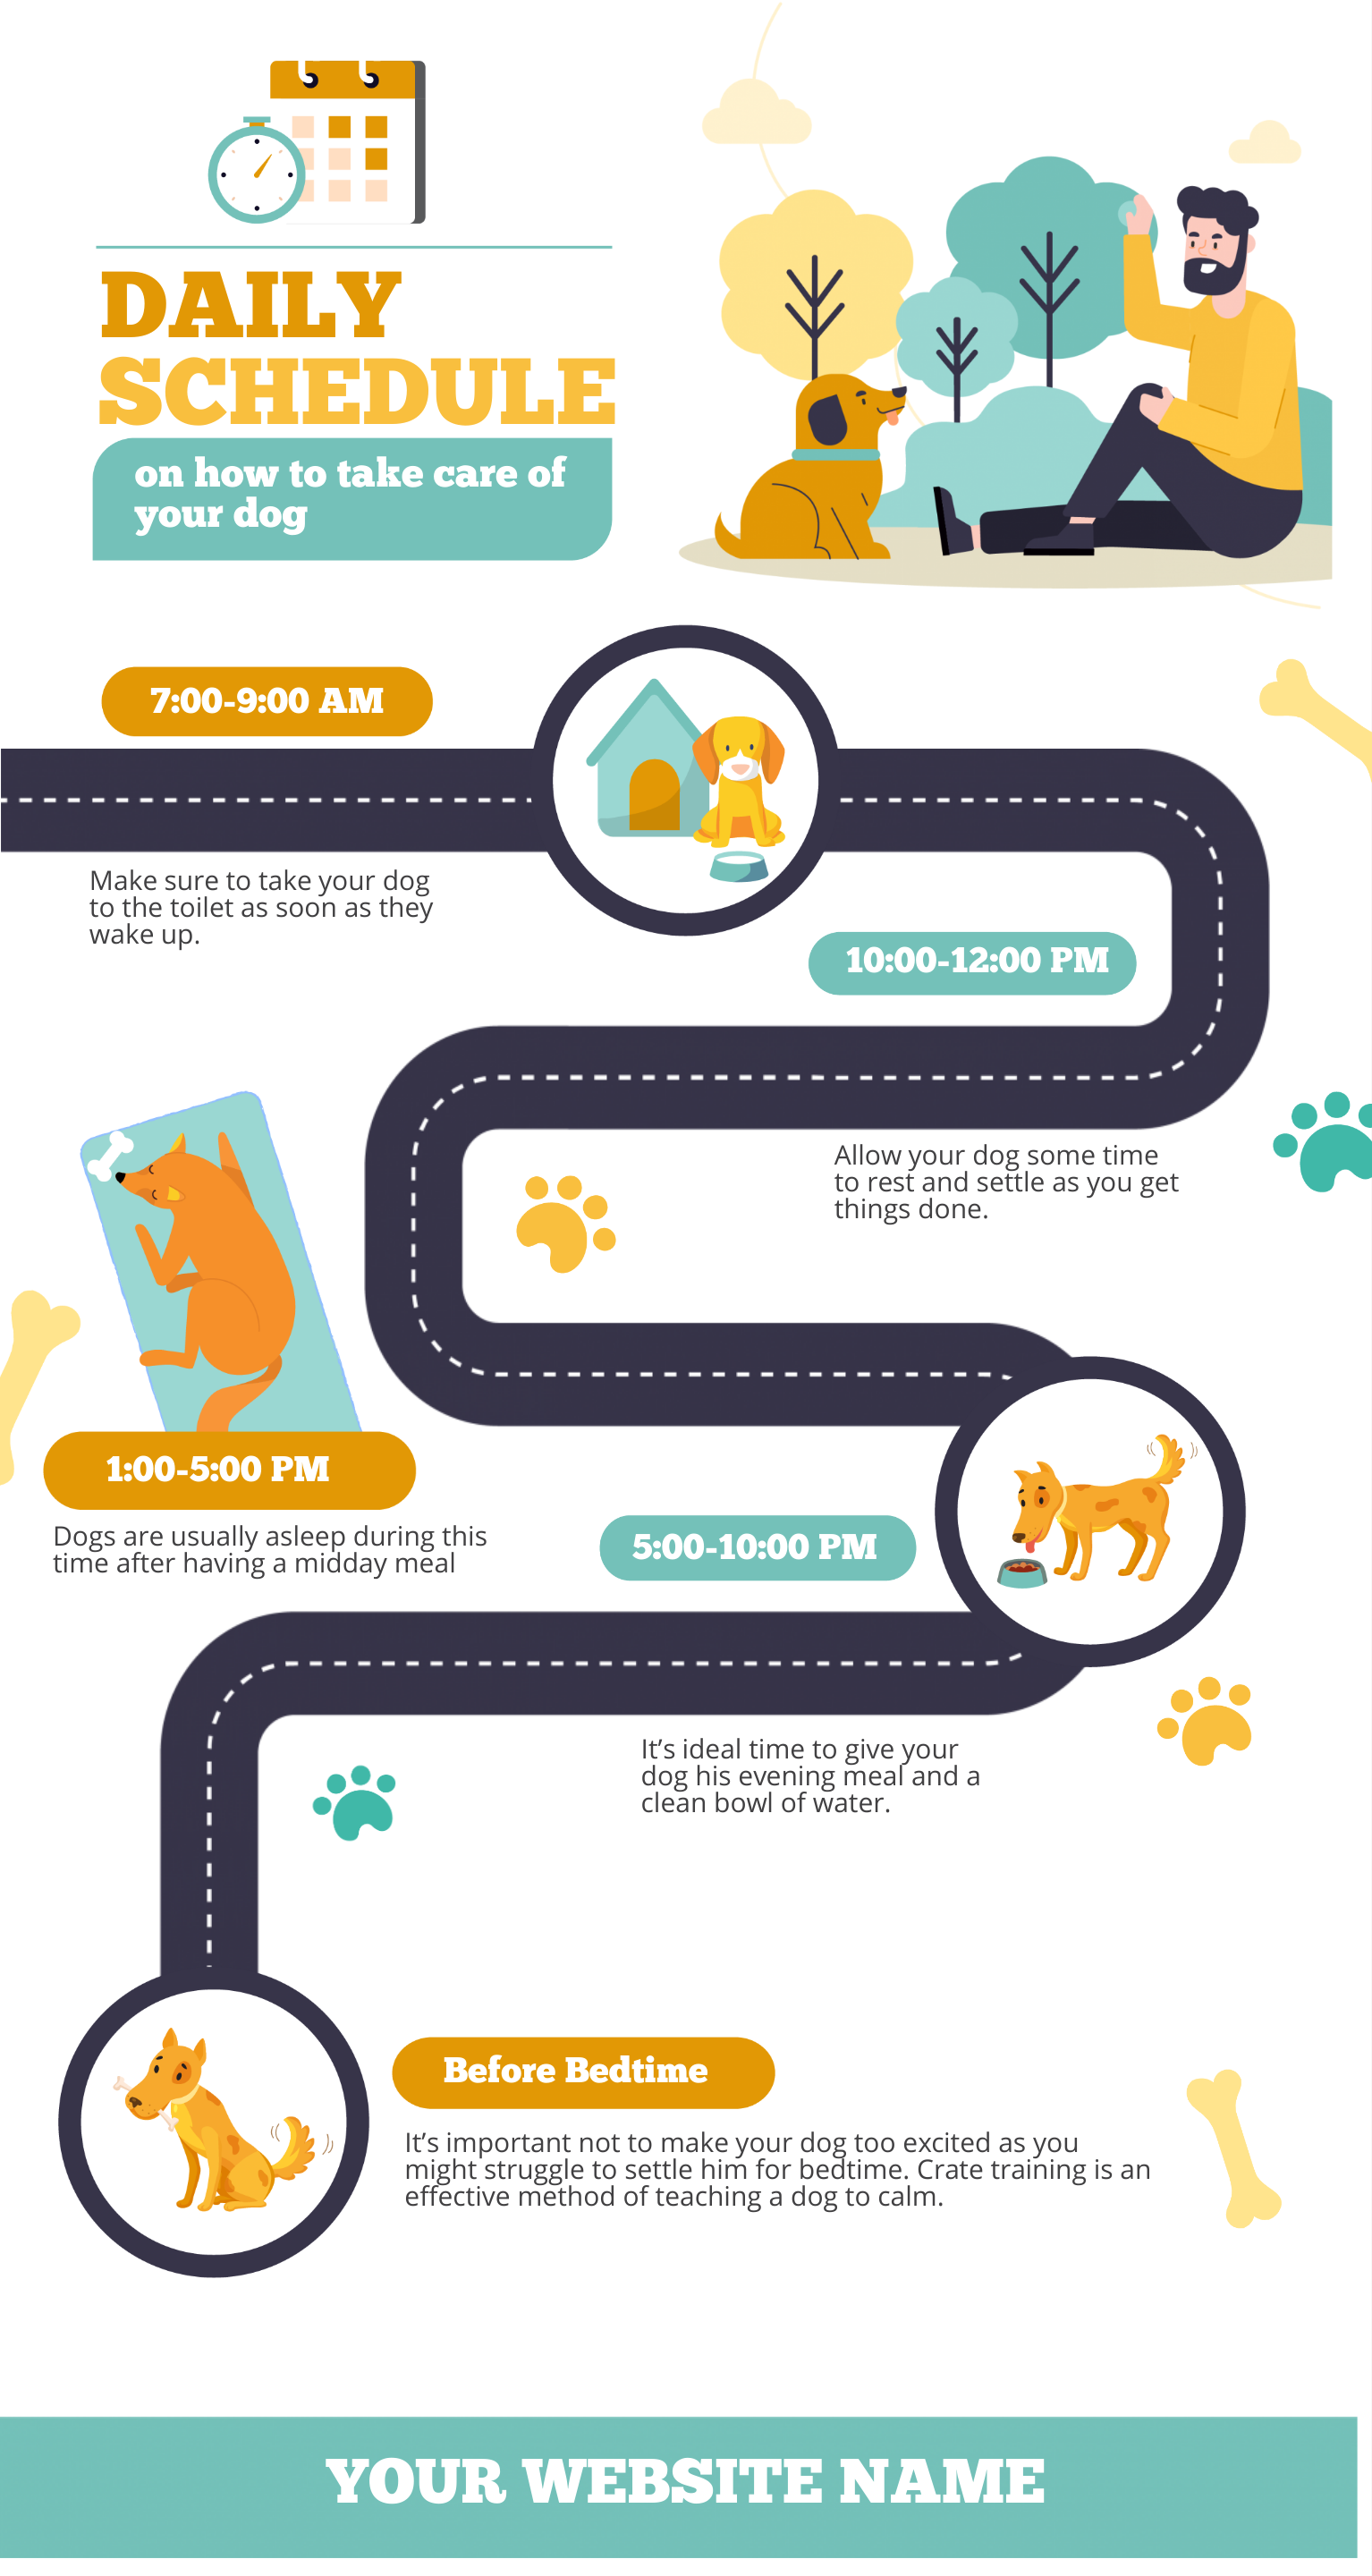
7. Timeline infographic
Use the timeline infographic format when you want to tell a story chronologically.
When to use:
* show how something has changed over time
* make a long, complicated story easier to understand
* show how one thing leads to another
Example:
Learn more: How to Use Timeline Infographics + Templates to Download
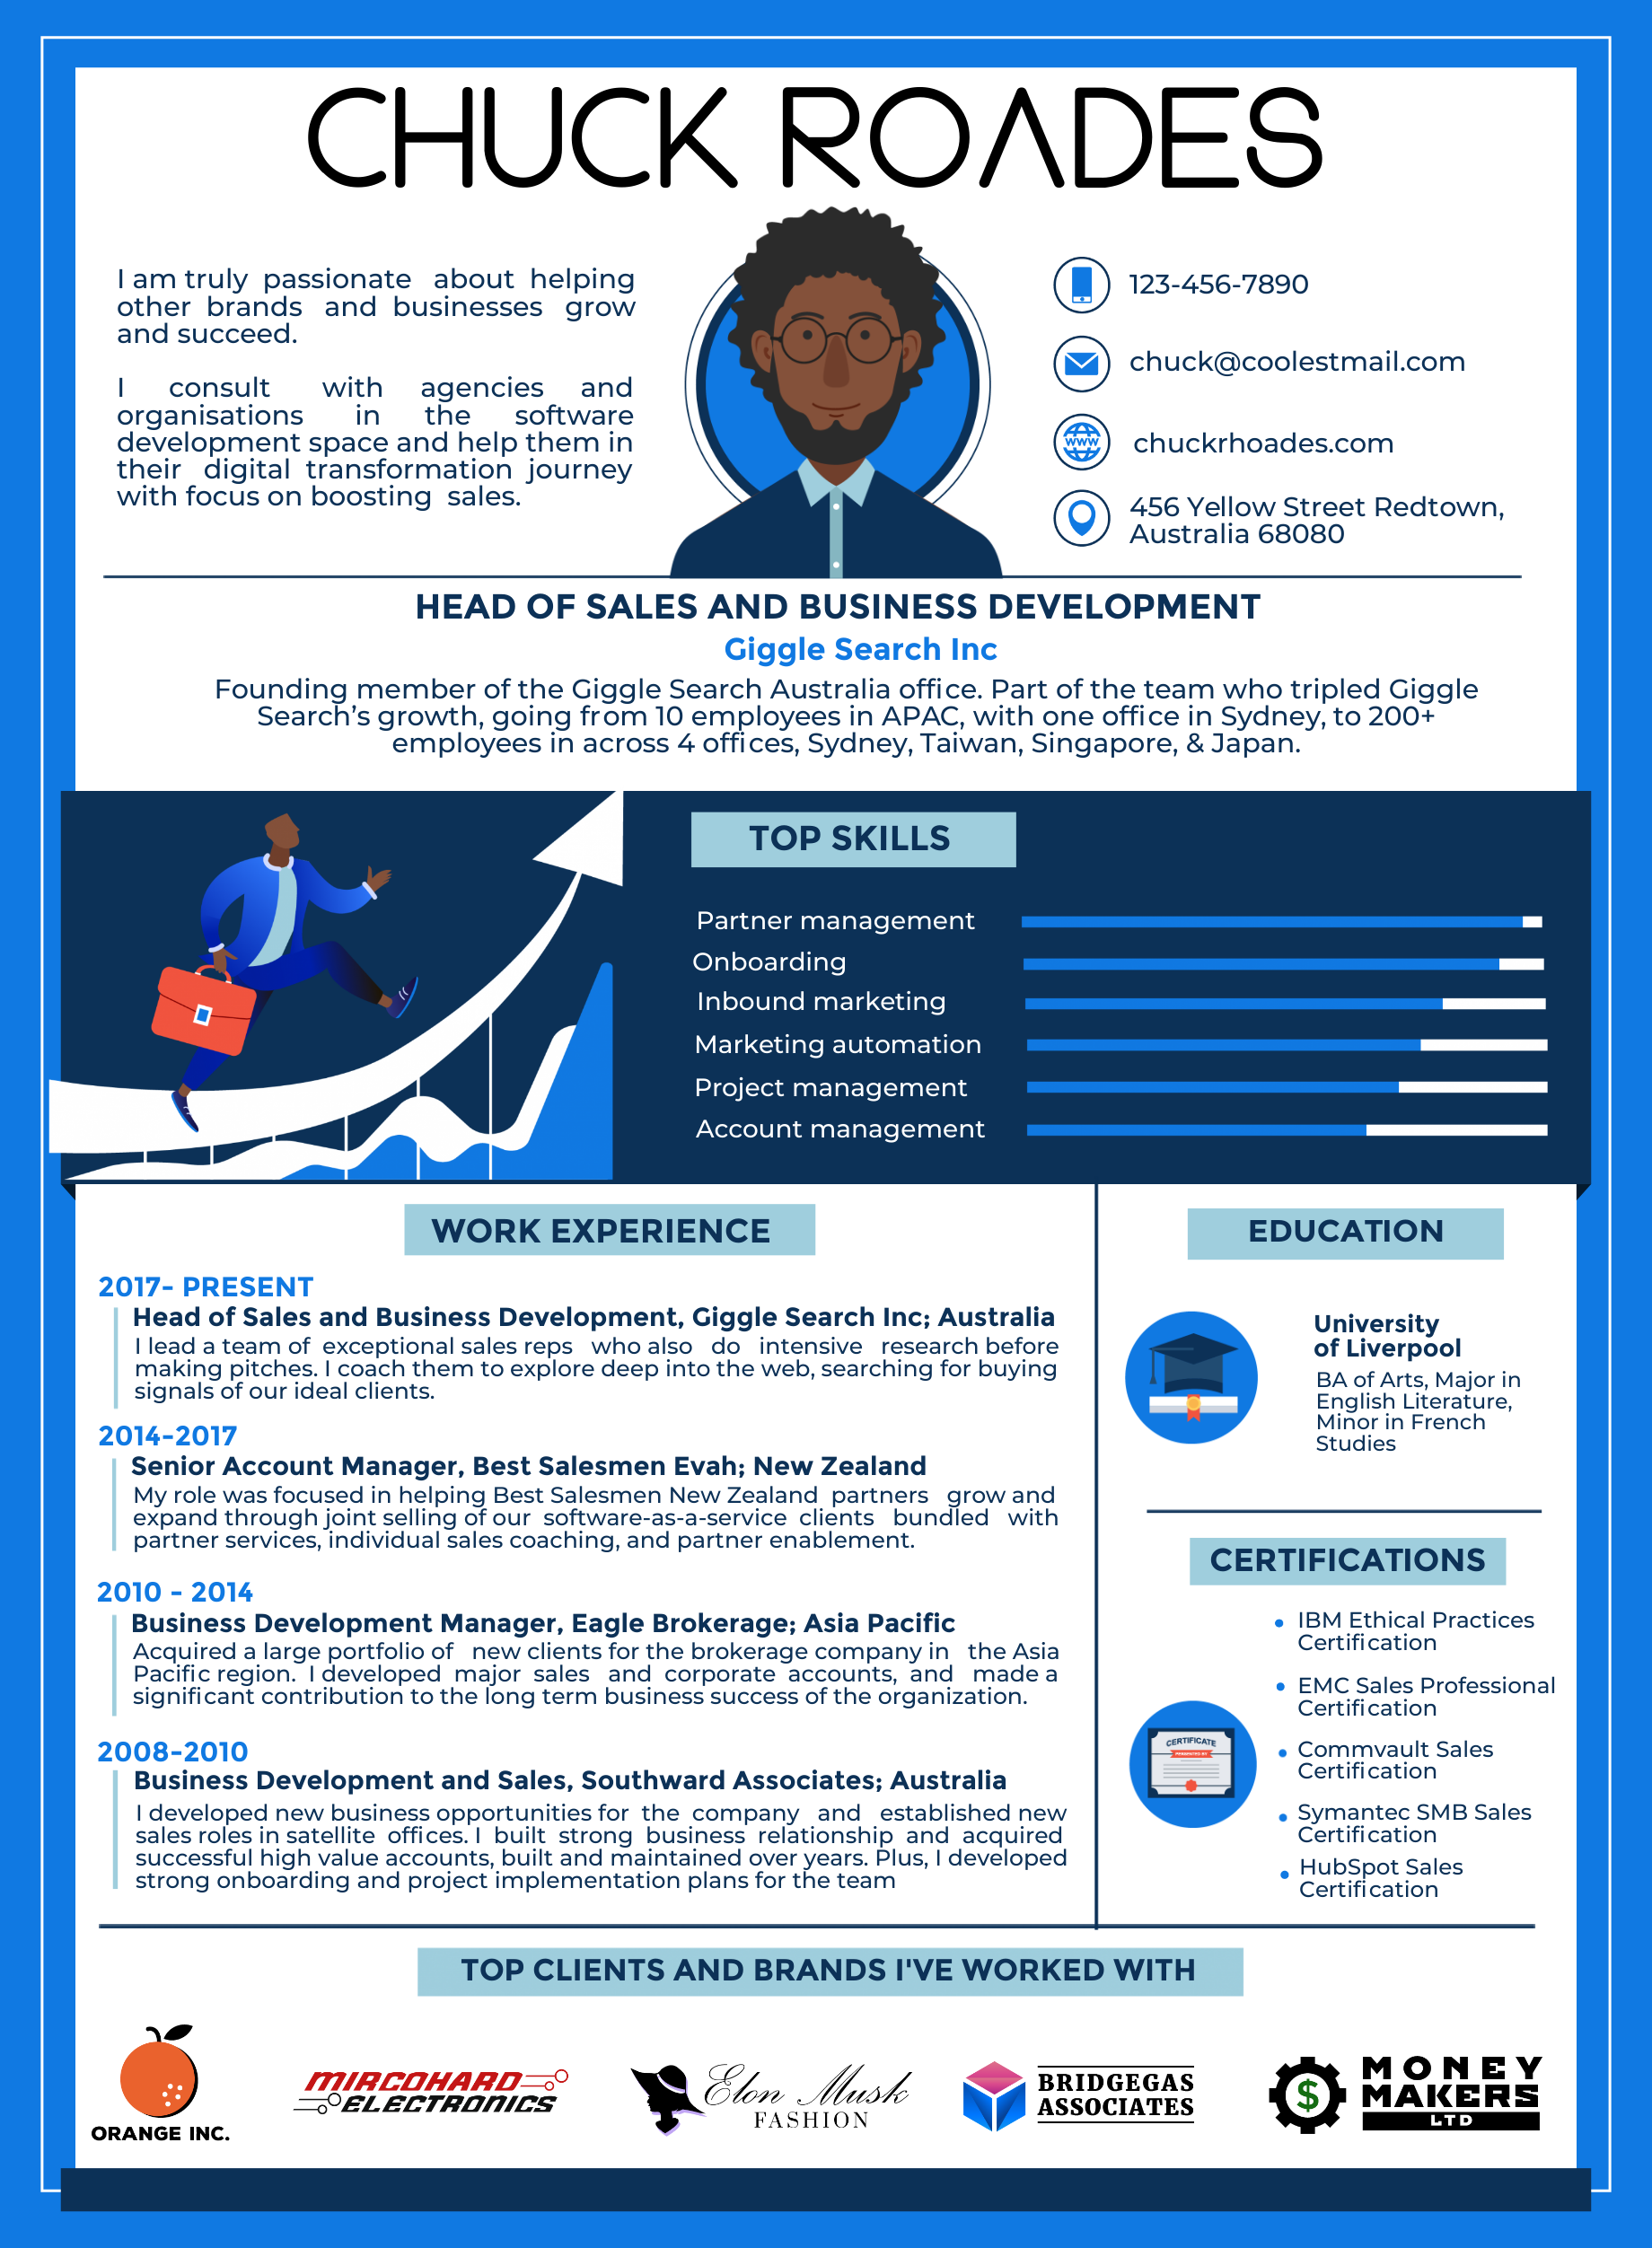
8. Visual resume
An infographic resume helps job candidates in getting noticed during the recruitment process by turning their text-based resumes into stunning infographics.
When to Use:
- Stand out in industries that are the most open to non-traditional resumes such as graphic design, marketing, and tech startups
Example:
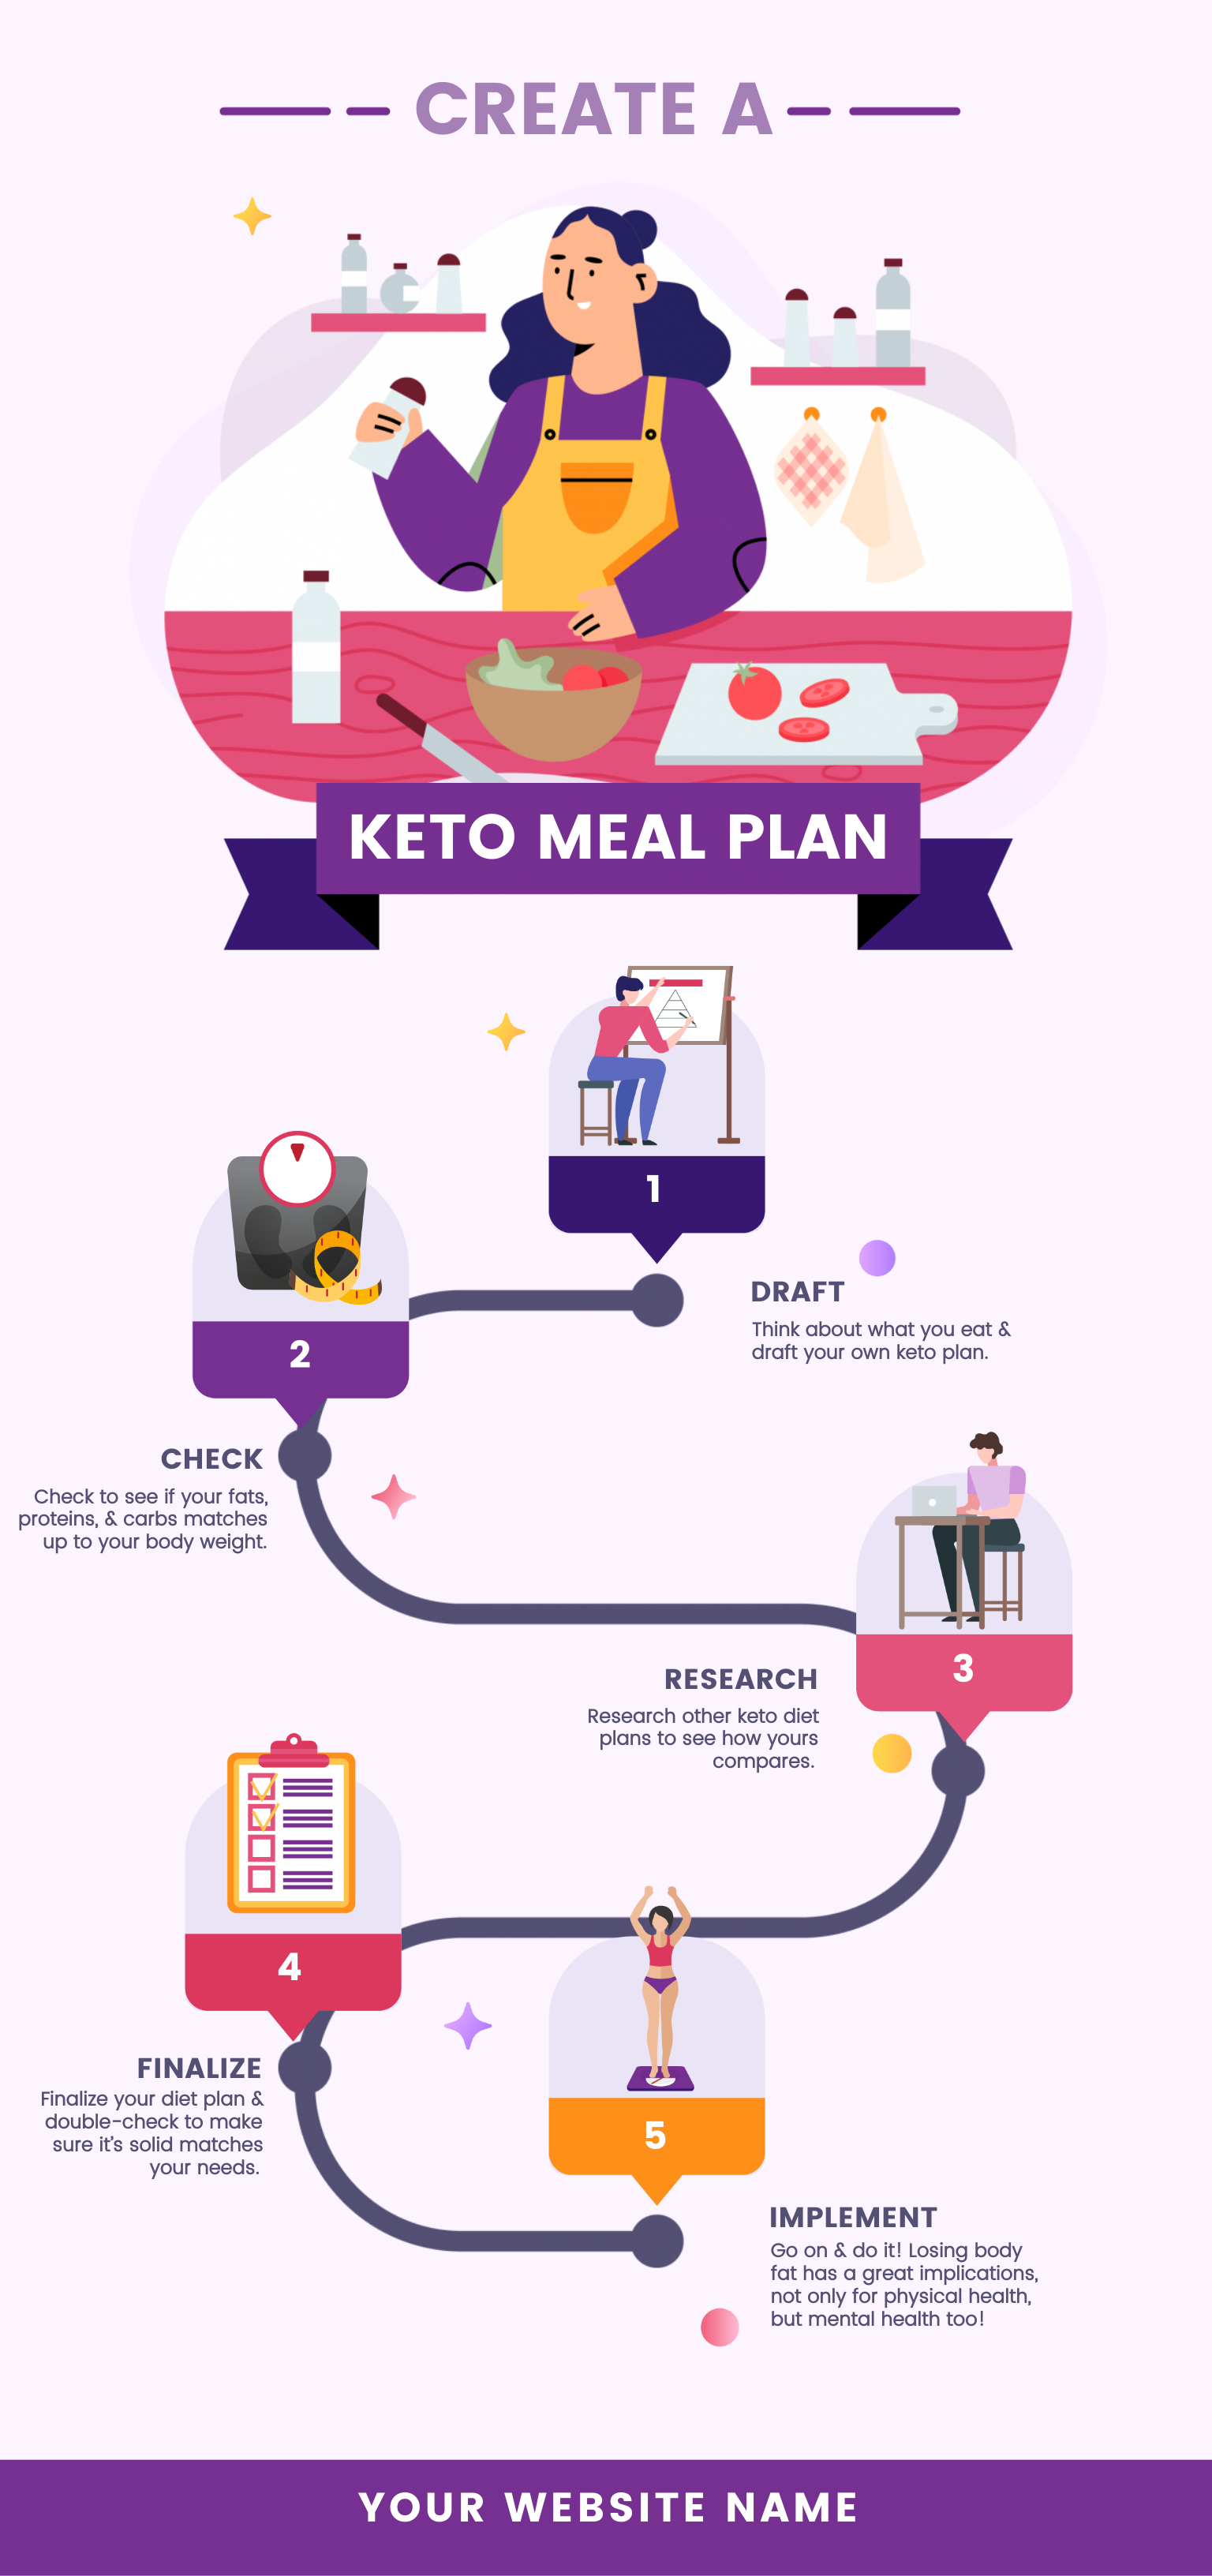
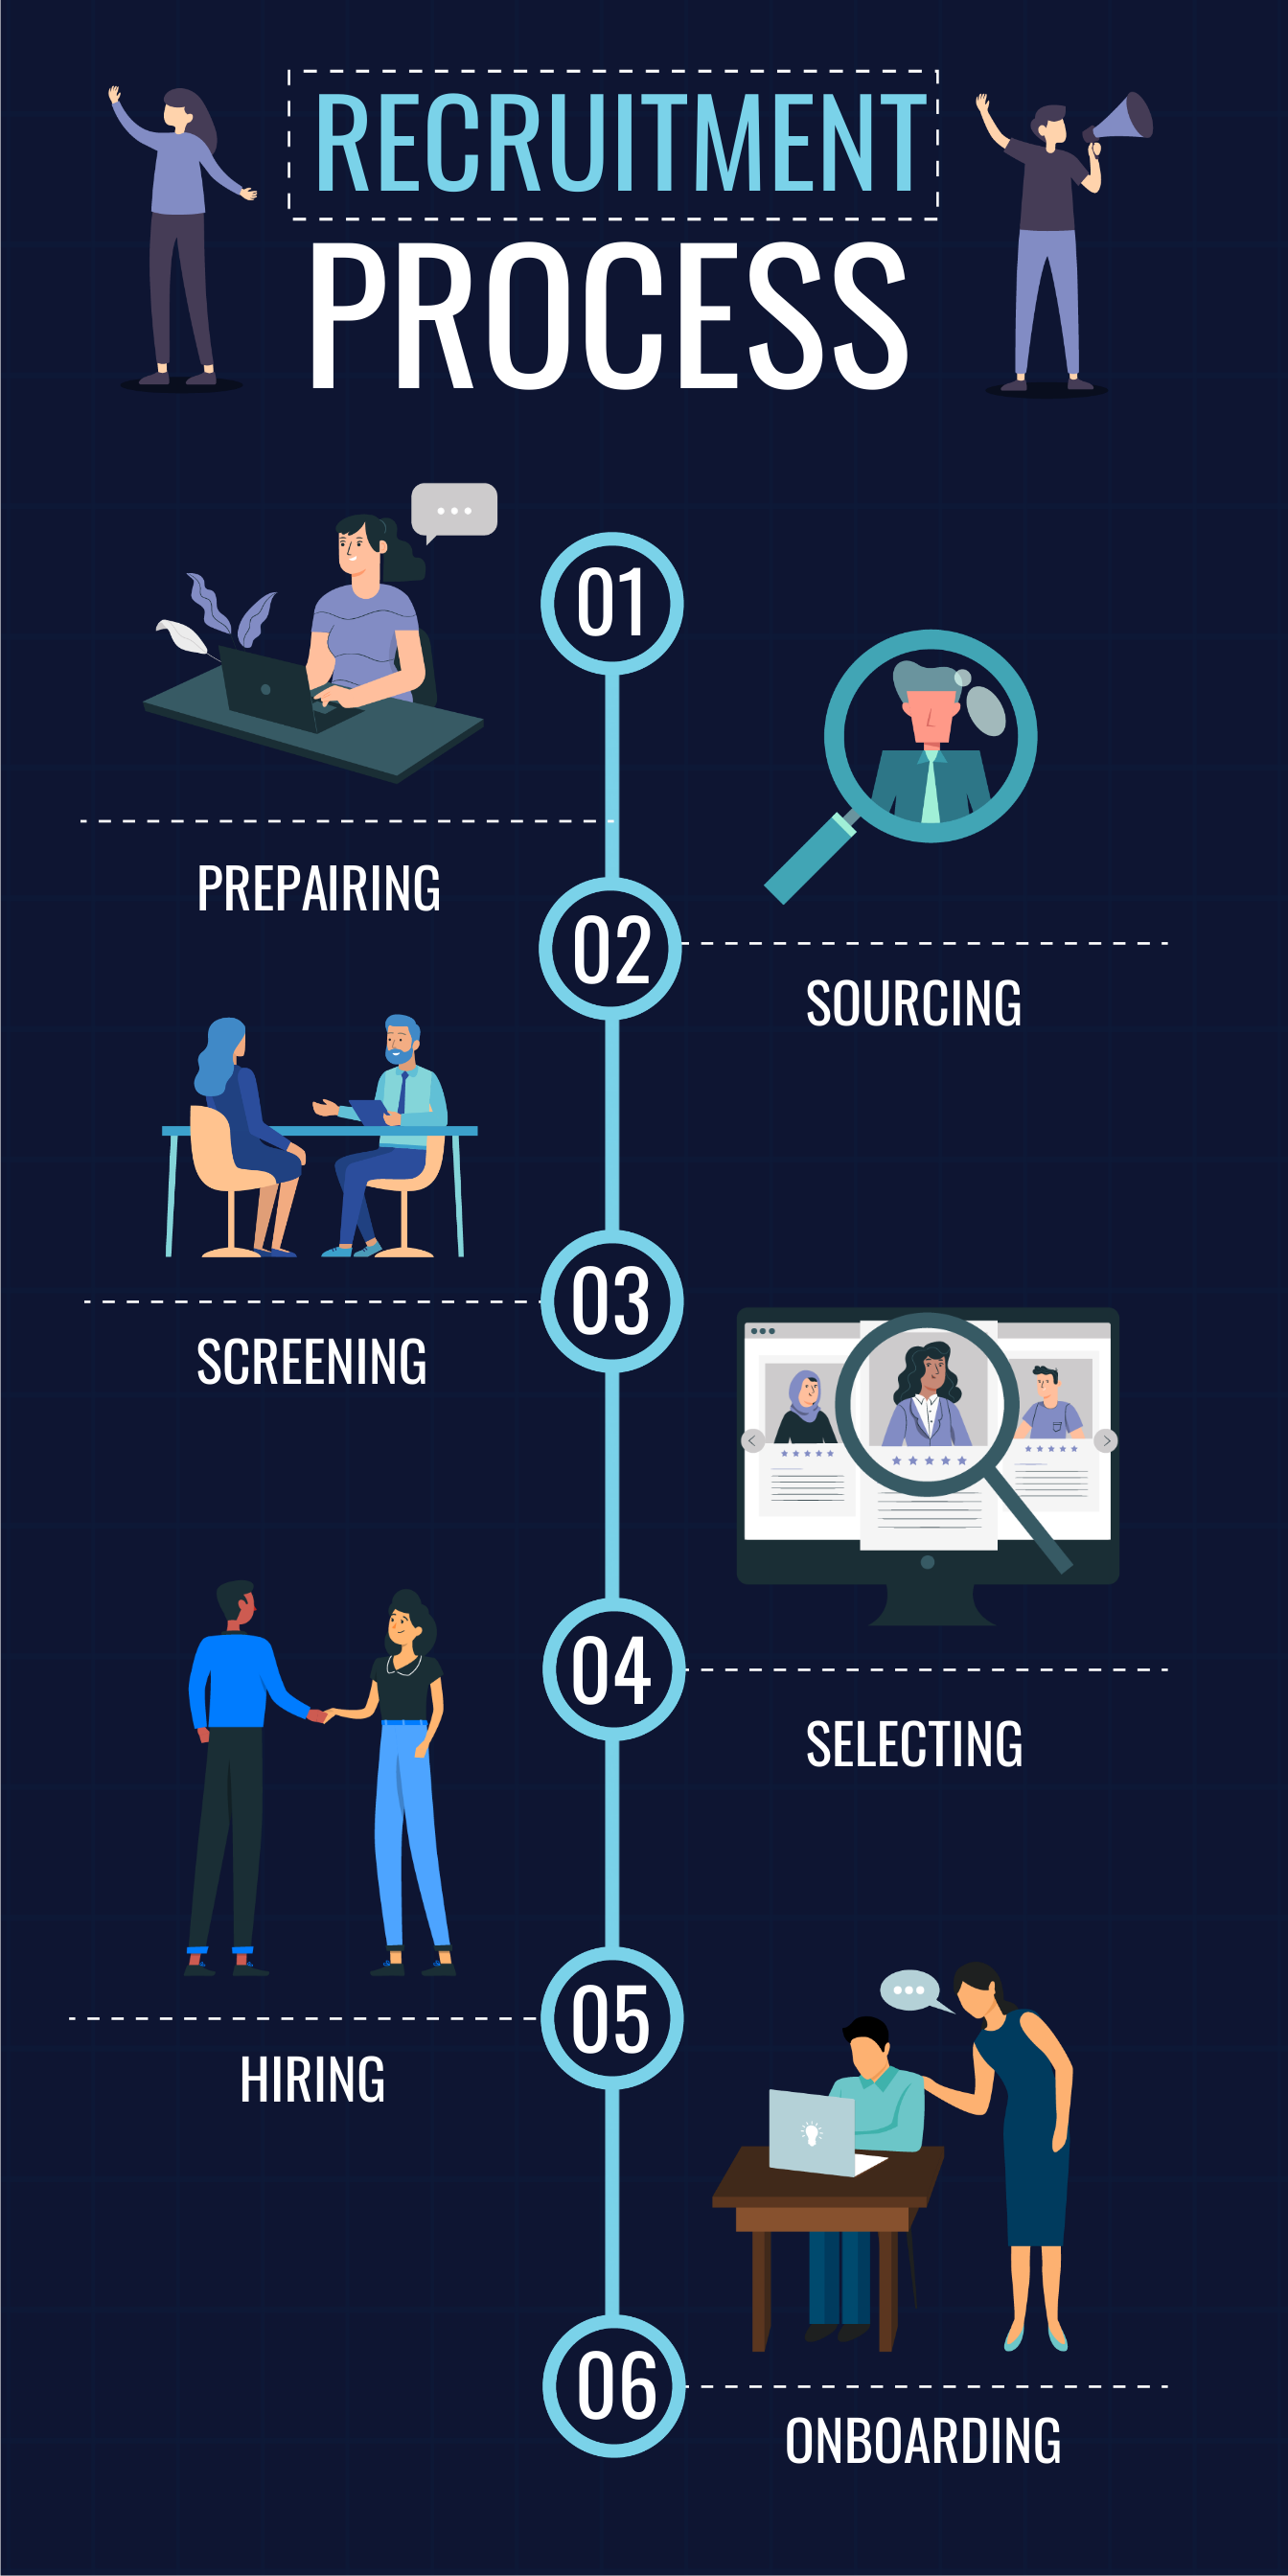
9. Process infographic
A process infographic helps explain the steps of a process, somehow similar to the flowchart.
When to Use:
- Simplify and break down a complex process into easy-to-digest steps or pieces of information
Example:
10. Animated infographics
Animated infographics are a great way to get your audience’s attention through interactive elements, pops of color, or smooth transitions. The subtle micro-animations help highlight particular sections in your infographic.
When to Use:
Attract audiences who favour creativity, out-of-the-box ideas, and novelty in the types of content they consume
Example:
Ready to make your infographic?
It’s incredibly easy to start making your infographic. You can either tinker with pre-made infographic templates or hire a professional infographic designer to create it for you.
If you’re still unsure about the right infographic type to use, have you thought about writing an infographic design brief?
Writing a creative brief will help you discover why you’re creating the infographic and which infographic type is the most appropriate.

