Sonia Guilana has beena high school English and German teacher since 1996, and has been an IT trainer for the Department of Education in Catalonia, Spain since 2005. She also just happens to be one of Easel.ly’s most engaged users, and it’s been a pleasure interacting with her on Twitter.
We love the tagline on her 21st Century Teaching website:
“It’s an exciting time to be an educator. Society is currently undergoing a revolution and Compulsory Education needs serious rethinking if we want to engage our students.”
As those of us in the States are right on the edge of another school year, we couldn’t agree more. Tons of teachers are starting to explore ways to incorporate today’s technology to education, entertain, and inform their students. Since Sonia is both a teacher and an IT trainer, we wanted to get a taste of what she knows about infographics and how they can be used to learn and explore in the classroom.
Techie Teachers
Sonia explains that, along with other methodologies, she enjoys using infographics in the classroom to “convey info in a more engaging and powerfully communicative way, and to unleash students’ creativity when presenting their projects.”
Sonia’s website, Techie Teachers, is another great resource for anyone looking to introduce technology and its many assets to their classroom. She frequently uses infographics in her English Language classes, and encourages students to incorporate what they’ve learned with visuals.

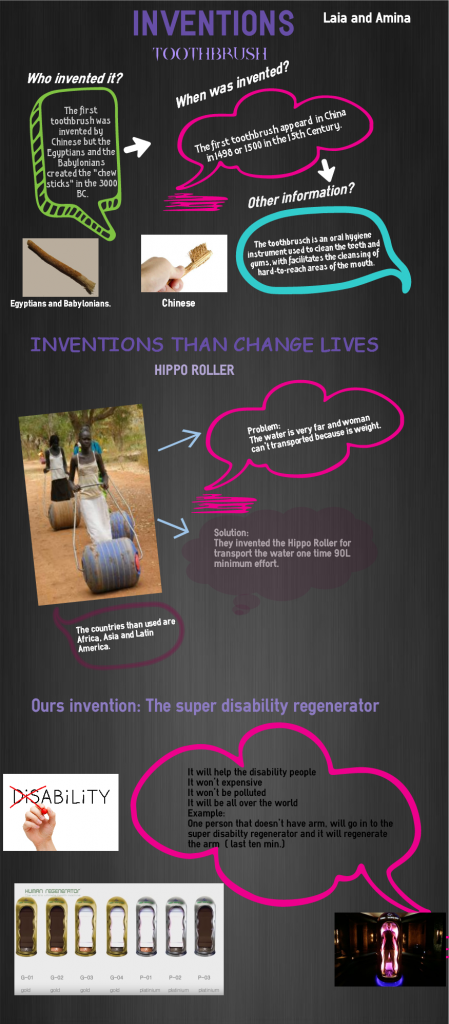
With her 14-year-old students, she creates infographics to discuss different topics, like inventions that change the world:
Sonia told us: “I am happy to use Easelly to help my students visualize information and transform it into learning at all levels, both primary and secondary, but also [at the] college level.” Because infographics are easily adapted to new units and different subjects, they are the perfect visual communication tool. Sonia uses Easel.ly because it’s simple to introduce to students, and they can grasp the Creation Tool easily (see what we did there?).
She incorporates infographics for a variety of units, and has students both learn from infographics she provides and teaches them to create their own infographics. Sonia has also found that using visuals helps engage students much more than using written worksheets or lessons (see the comparison below).


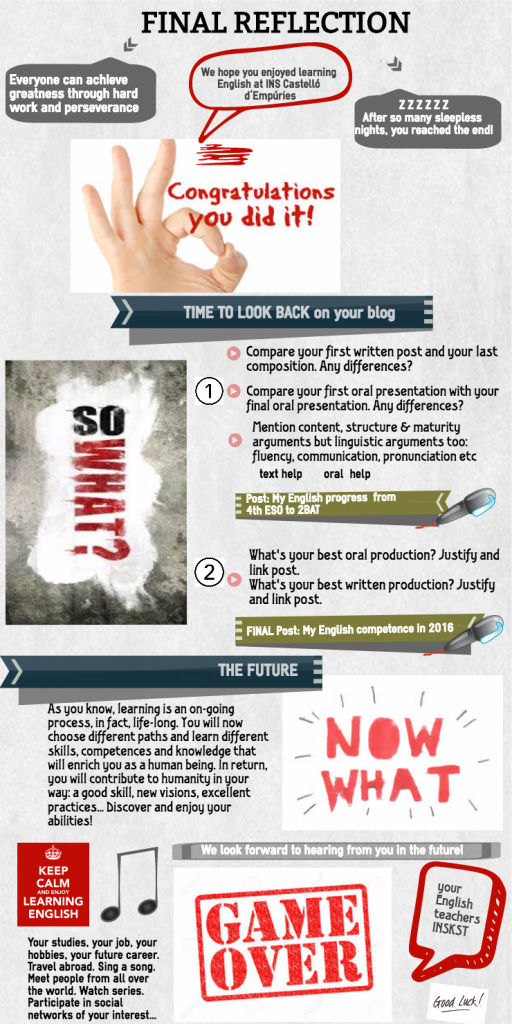
Sonia’s students get to create plenty of digital work for their units, and they also compile an e-portfolio. This highlights what they’ve learned, how they’ve applied it, and can showcase that learning in highly visual and intriguing ways.
Teaching Teachers to Embrace Tech
Sonia is so passionate about EdTech that she also teaches teachers about it, and has programs that she runs with the Department of Education in Catalonia, as well as by herself. Her modules for Ateneu, a Catalan online learning tool, discuss everything from copyright issues in visual education to which platforms to use to make a teacher’s life easier. If you’re curious about visual communication in your classroom, we highly recommend checking the link out!
On her personal program website, Teaching Teachers, Sonia also shares her insights into visual communication and how it can affect a student’s ability to engage, contribute, and think critically in today’s technology age. She has a ton of great resources for teachers who are interested in moving forward as contributors and challengers of traditional, outdated modes of teaching.
Info-xication
We at Easel.ly also learned a new word from Sonia: infoxication. She says, “In a time of ‘infoxication,’ or massive information overload, visual presentation of data is the way to help effectively save time and make it more memorable.” We couldn’t agree more, and we believe teachers are seeing this rising trend as well.
Thankfully, more and more teachers just like Sonia are exploring ways to interact with their students in increasingly engaging and effective ways.
If you’re hoping to find more ways to stay up-to-date with visual communication, data visualization, and more, head on over to our Show, Don’t Tell blog and check us out on Twitter for more EdTech love every week!
