
Infographics have come a long way.
But where did infographics come from and how did they get to be so popular?
Infographics, by definition, mean images that share information in visual ways. When you break it down like that, so many pieces in our history actually qualify as infographics. Let’s take a little trip back in time, shall we?
Where did infographics start?
How did infographics evolved from cave paintings to today’s data visualization techniques?
Watch the detailed history of infographics and its evolution in the video below.
The Internet + Infographics
With the use of the internet increasing through the early 2000s, more internet companies begin offering unique graphics and more marketers begin to understand the value of visuals on websites and social media
- 2012: Easelly, a simple infographic maker tool, was launched!
- 2012-2013 Infographics are “googled” 800 percent more than in years prior.
- 2014-present day Infographics are used in classrooms and businesses to educate, entertain, and engage!
Why are infographics so popular?

- Infographics increase learning upwards of 400% thanks to visuals. Humans can process an image within 250 ms
- For online businesses, infographics can increase conversions. An analysis of blogs in different industries done by Quicksprout revealed that articles with data-driven visuals such as charts and graphs receive more trackbacks – 258 percent more than blog posts with other types of images.
- Images speak to the emotional centers of the brain. Organizations and people can tell their stories with infographics
- Our eyes jump straight for images! In a content-overwhelmed world, people look for the most relevant image first.
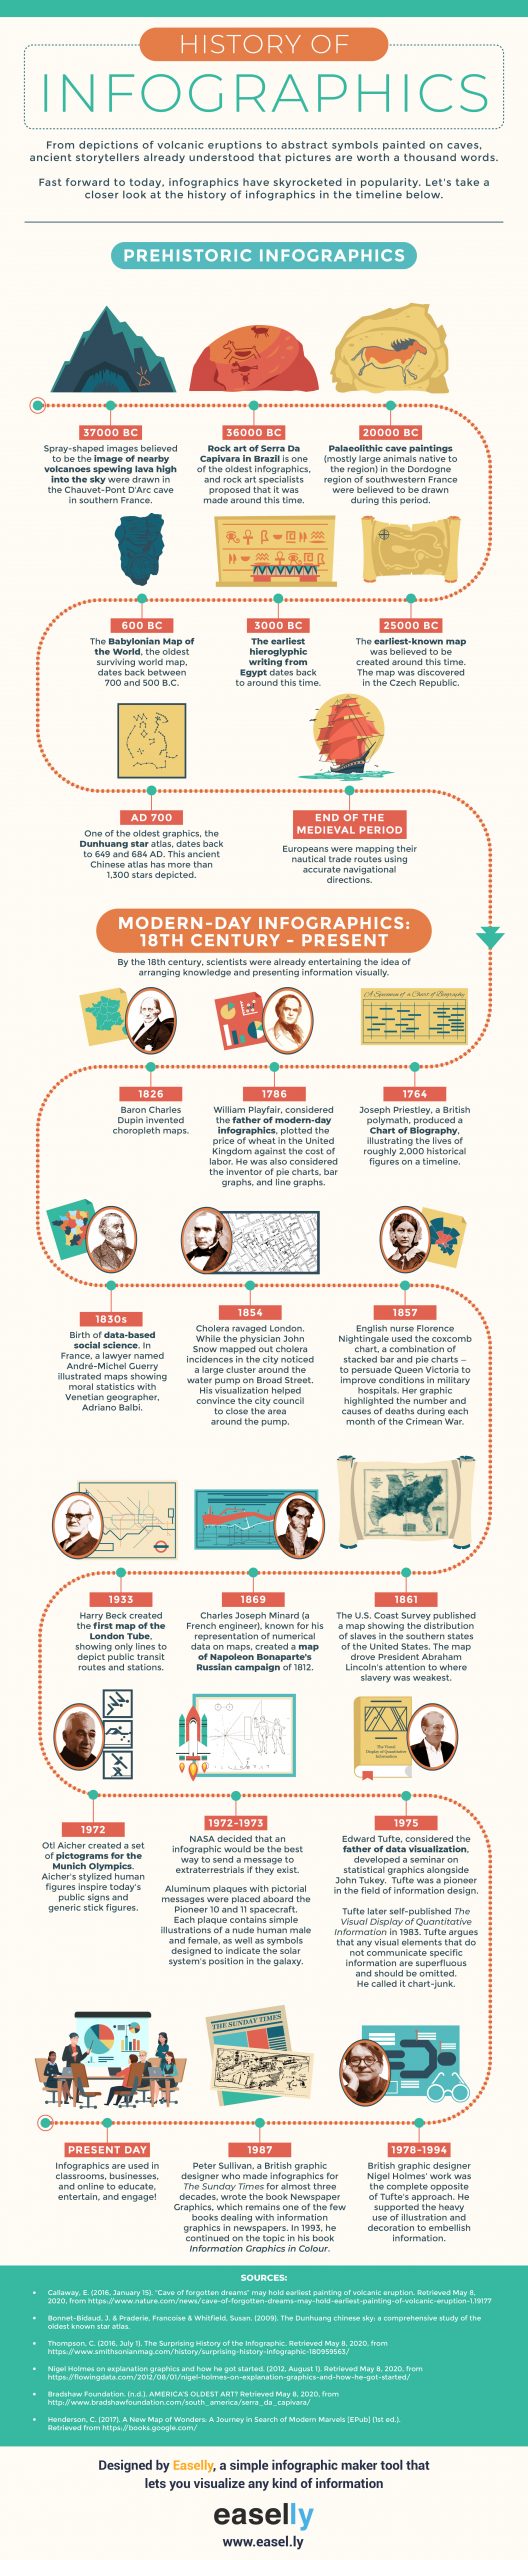
Want to see the history of infographics in infographic format?
If you’d like to use the infographic below, we’d really appreciate a quick note on attribution or a link to this blog post.
It’s your turn to make history and share your stories, ideas, and insights through infographics!
You can either start with our simple infographic maker tool or hire a professional infographic designer if you’re pressed for time!
*Editor’s Note: This blog post was updated on August 3, 2020 for accuracy and comprehensiveness. It was originally published on February 20, 2017.