Being an educator is quite demanding. Even though there are various seminars, classes and books on how to improve your teaching methods and behavior during classes in general, not everything can be explained in this matter. There simply can’t be a rule book about working with unformed young people – if you have been an educator for at least a few years, you already know that just when you think you have mastered teaching, a student finds a new way to surprise you.
However, you need to be the one to surprise them. You should bear in mind that the development of informational technologies has affected the younger generations. Students are getting harder and harder to impress, because they think they know everything. The scary fact is that they do know a lot – even if they hear an unfamiliar term, they can look it up in a matter of seconds. So, how do you make them pay attention?
Improvement of the teaching process

It’s quite important that the entire school system improves and becomes a part of the age of technology. Like it or not, schools and universities will have to go through a serious technological overhaul sooner or later, so it’s better that we introduce changes one by one, not all of them together. If you want your students to listen, and not only hear what you’re saying, but ask questions and engage in discussions, it’s quite important for you to find a way to intrigue them and spark their curiosity. You should definitely try to use their desire to know everything – when a student is curious about your subject, they will pay attention, and that additional interest they show will help them store all the facts that they have heard in their long-term memory later on. However, the real question is how to invoke curiosity from a generation that’s hard to surprise and even harder to impress?
Visualization is a powerful learning tool

There are lots of useful tools that can be taught to students in order to help them develop their memory. In fact, some children develop their own unique set of memory tools. However, whether they’re writing things down, studying out loud or drawing sketches, all of them respond to visual teaching aids incredibly well. Our eyes can register 36,000 visual messages per hour! Various colors, different fonts and creative shapes can all be used together to help students to learn more efficiently, but they can also help educators keep their students focused on the topic at hand, without the need for wasting any extra energy on warnings and reestablishing order in the classroom, besides visuals are processed 60,000 times faster in the brain than text!
Albert Einstein once said: ‘’It is the supreme art of the teacher to awaken joy in creative expression and knowledge’’
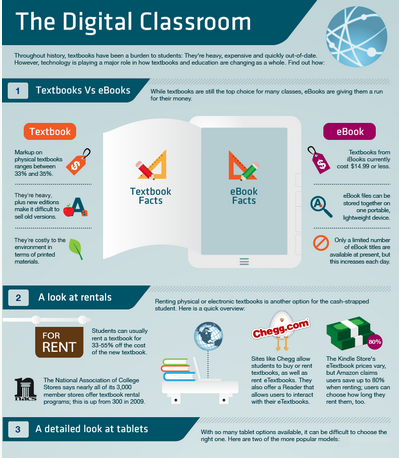
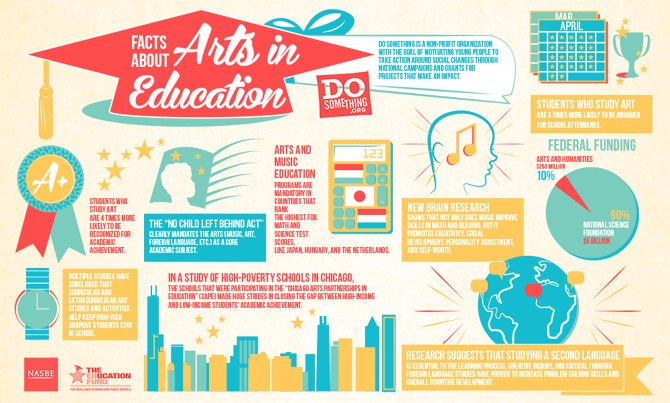
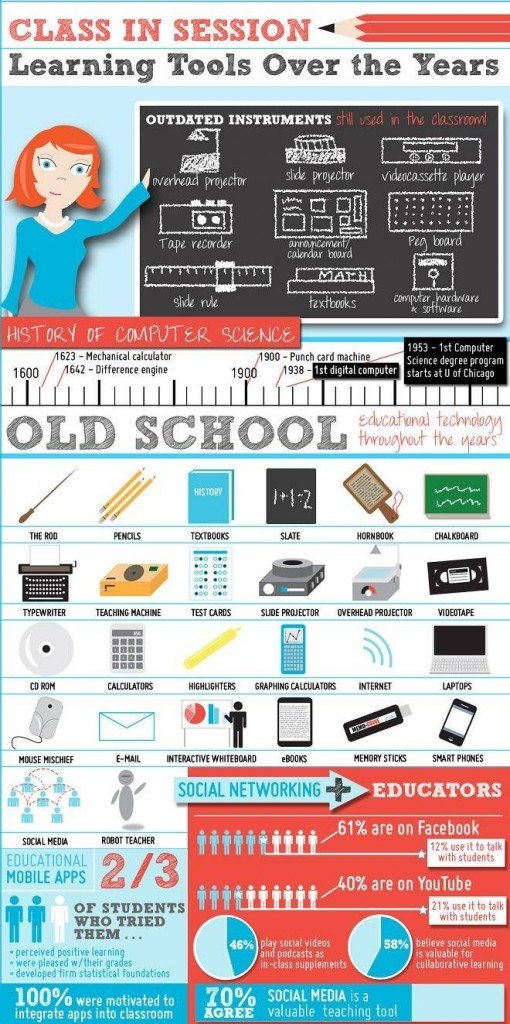
Use of visuals like infographics can be quite beneficial to both student and teacher. They allow you to create your lessons around a central image, something that the entire class can be focused on as you speak, so you don’t have to check your notes every couple of minutes to make sure you didn’t forget something. The brain can see images that last for just 13 milliseconds.
Introduce Humor to To Your Classes
Everybody loves a good laugh. Creating infographics can help you find a way to present your subject from an interesting perspective that welcomes intellectual humor. This is just another way for your students to remember classes better, and another reason why infographics are the perfect medium for it – you can add funny drawings or a play on words, without it affecting the core concepts you wish to convey. Either way, it will be quite effective.

Play with Infinite Possibilities

It’s like you have a blank piece of paper in front of you – practically everything that comes to your mind can easily be turned into reality. With Easelly you can naturally organize all possibilities, so that everyone can use a visual aid without any troubles whatsoever. It’s quite amazing what you can do when you have that many different ways of presenting a subject.
It’s Easy as It Gets with Easelly
Speaking of organization – making infographic couldn’t be simpler or more efficient than with Easelly. Before finally creating our platform, we did some serious research in order to determine everything that was necessary for us to make a harmonized selection, and we excluded everything that makes our tools too crowded and complex. Once you click on the button that leads you to the page where you can create a new infographic from scratch, you’ll be able to see a neat header in soft colors that actually navigates you through the whole process of creation – when you see all your options in front of you, you’ll be able to bring your idea to life quickly and effectively.
Whether you want something in black and white, with classical shapes, or you prefer something with crazy colors and unusual figures, you’ll be able to create a powerful teaching tool in a short period of time.
Once you start introducing infographics to your classes, you’ll be amazed with how much easier and more fun your job will be. There’s one more really interesting use for infographics that I should also mention – if you gather all your students’ email addresses, you can put in some additional effort and supply them with a few Easelly infographics that they can use as notes. Quite practical, right?
This is a really simple teaching tool that both parties – students and educators – will be grateful for.
So, what are you waiting for? Open the Easelly designer and start creating your infographic!