With back to school season, teachers and educators are in the midst of designing and revamping their curriculum, always looking for new and creative ways to engage students.
As technology becomes more a part of our daily lives, students are using technology – mobile phones – to communicate with one another, receive updates from their teachers, and even complete their homework.
Even though students use technology in just about every aspect of their lives, it;s difficult to figure out how to incorporate technology in an organic and accessible way in the classroom.
Being able to incorporate new skills that keep up with technological advances is a challenge.
Data literacy is one essential skill that is becoming a core competency. DIY Data Art is a project that creates creative data literacy lesson plans, activities, and resources to empower educators to build youth data literacy skills in the classroom.
Below is an outline of how to facilitate a fun, creative data literacy activity that gets students using icons and quantitative skills to visualize their interests using the simple Easel.ly platform.
1. Choose a question.
Begin by having students choose a question that they would like to answer about themselves:
- What is your favorite place?
- Which device do you use the most often?
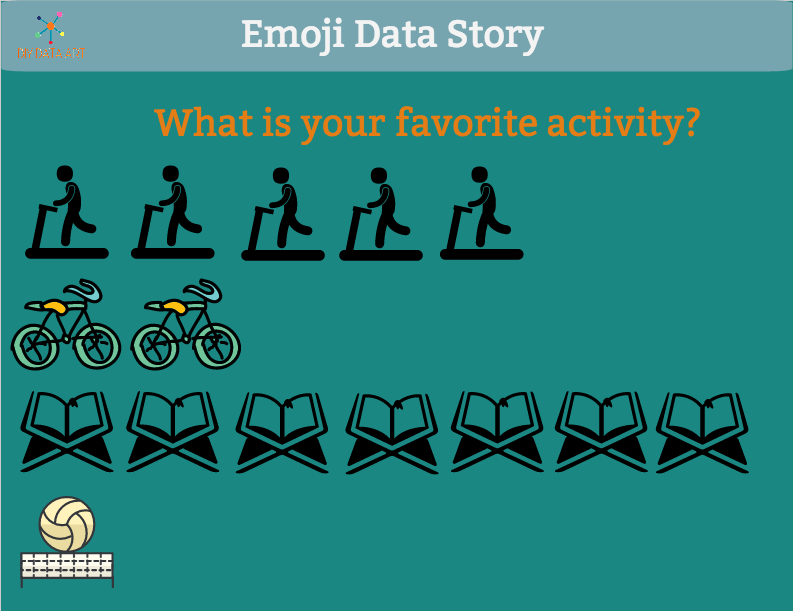
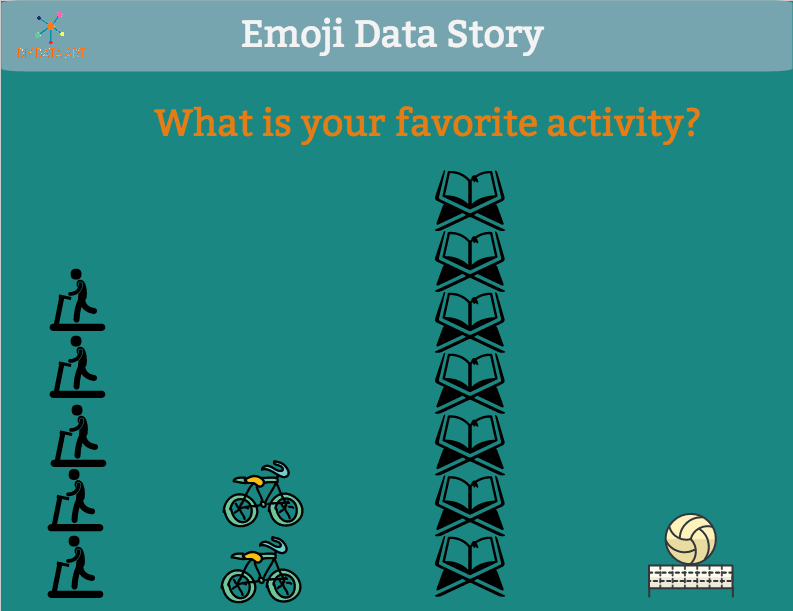
- What is your favorite activity?
- What is your favorite food?
- What is your favorite season?
- Who do you live with?
- What has your mood been like this week?
- What has the weather been like this week?
- What languages do you speak?
2. Have students create a title.
It can be the question they chose or a description of the question they chose. For example, “What is your favorite activity?” can also be titled as “Activities I did this summer” or “Favorite Activities.”

3. Use images only.
In order to answer the question, tell students they must use a minimum of 3 different icons to illustrate their answers. They are NOT allowed to use words outside of titling their project. Instruct them to use the number of icons to communicate their preferences. For example, if they really enjoy basketball and do not enjoy playing tennis, they should use fewer tennis ball icons than basketball icons to show which activity they like better.


Easelly has a range of icons to choose from to illustrate activities in the OBJECTS section.
4. Introduce new data and digital literacy vocabulary to students.
Emoji- a small digital image or icon used to express an idea, emotion, etc., in electronic communication.
You can explore what emojis signify and how images and pictures and icons all tell stories
For example: An “on and off” button symbol and charging battery – everyone knows these and just by seeing it, we know what to do.

Isotype– a method of showing social, technological, biological and historical connections in pictorial form.
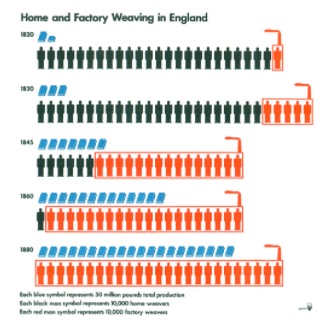
Example from: https://parsonsdesign4.wordpress.com/resources/isotype/
Bar chart– a diagram in which the numerical values of variables are represented by the height or length of lines or rectangles of equal width.
Explore different types of charts and ways of displaying information.
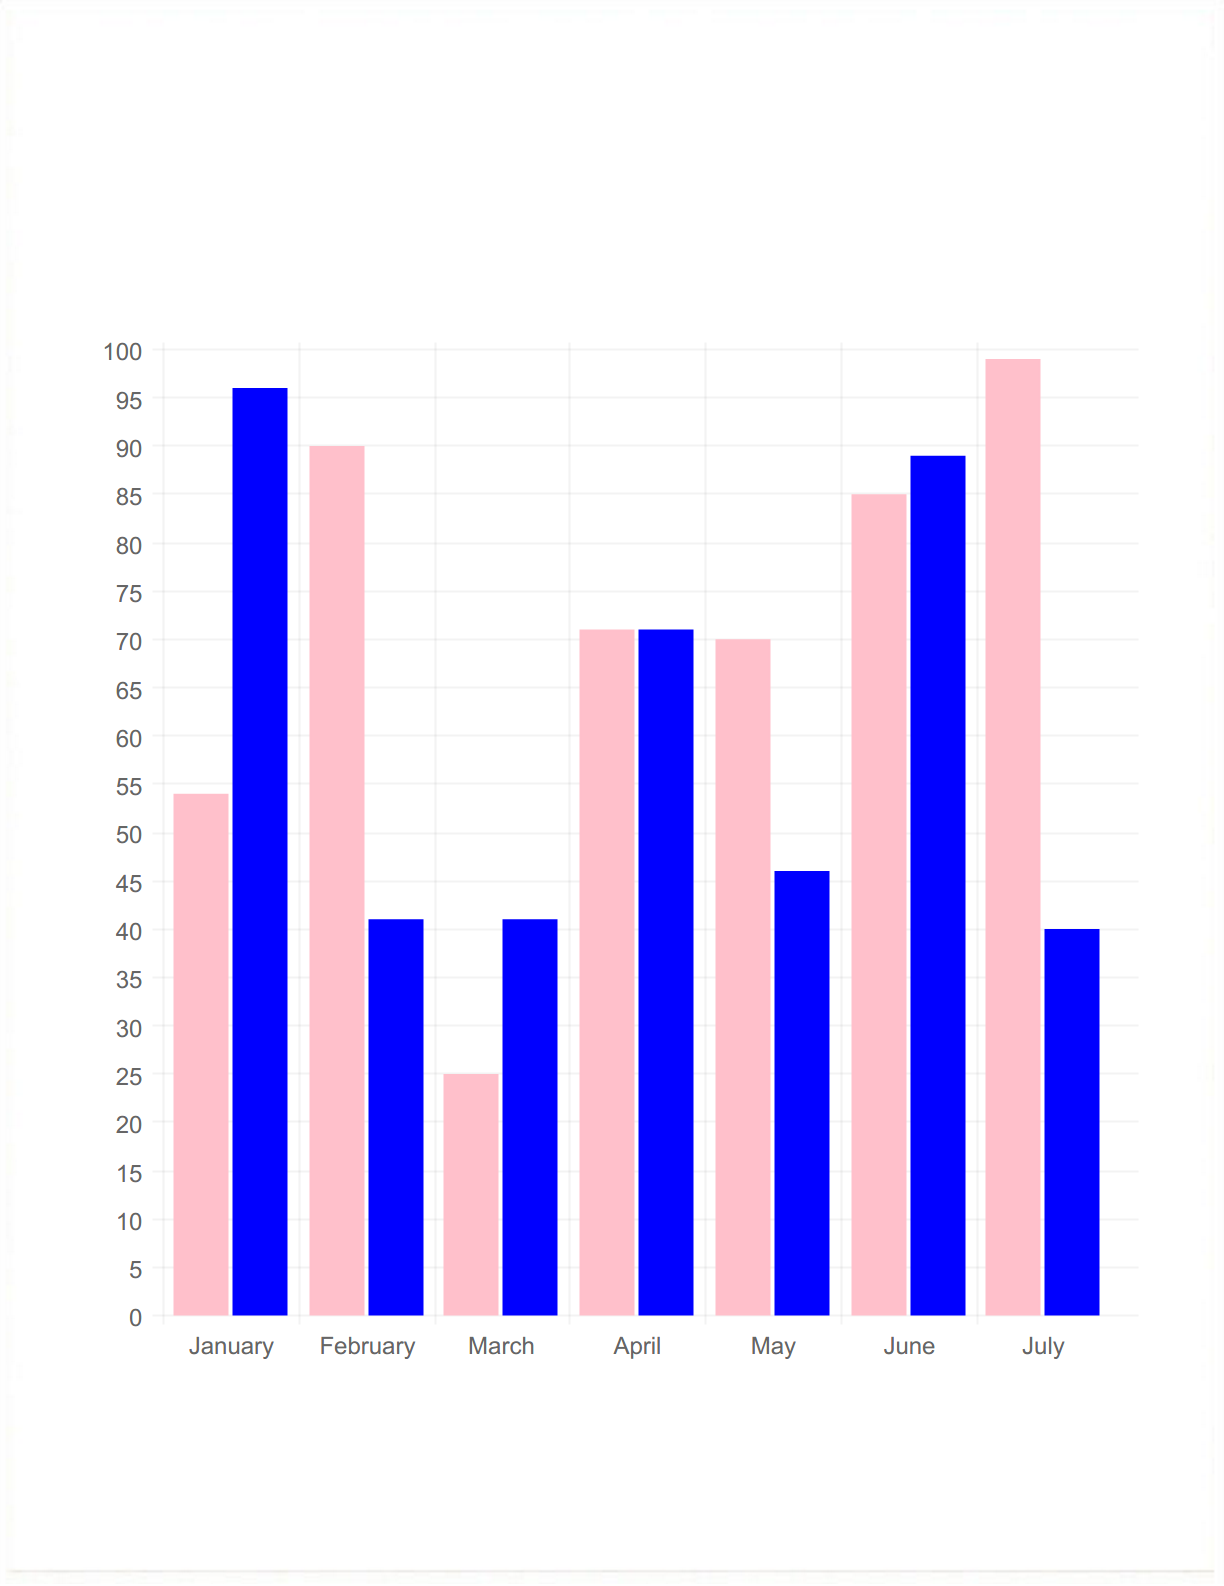
Customize this bar chart with Easelly!
5. Use different types of illustrations.
Each of these charts serves as an example of how students can illustrate their answers.
Ask students:
- How are these charts different?
- What are the benefits of using each of these charts?
- Which ones did you like to make the most?
Horizontal bar chart
Vertical bar chart
Pie Chart
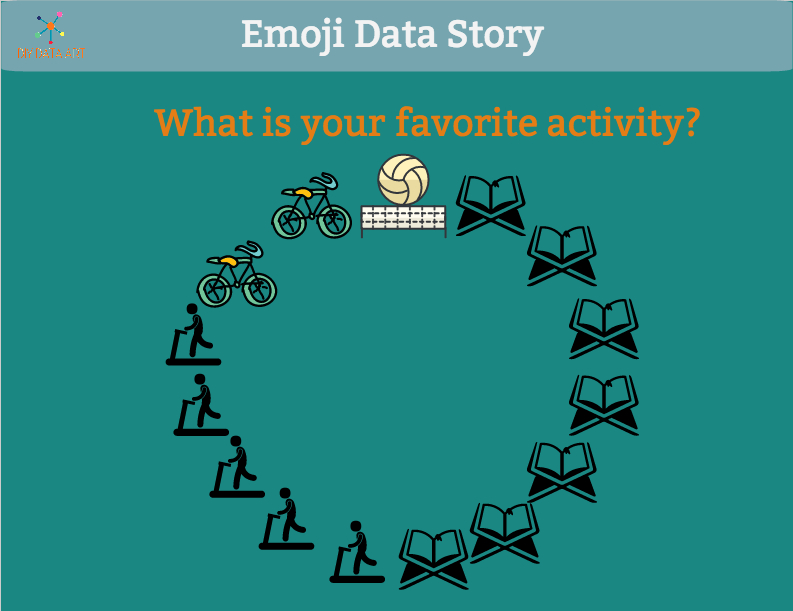
Other options for really ambitious students: Encourage them to create a chart in the shape of the topic. For example: if they are answering a question about their favorite TV shows, make the visual in the shape of a TV.

- Share with a partner. Have students find a partner or make a new friend. Ask them to share their illustrations and have their partner guess the answer to their question(s).
- Have students try and create another illustration answering another question!
Here is what one of Easelly’s team members came up with when she did the DIY Data Art Activity!
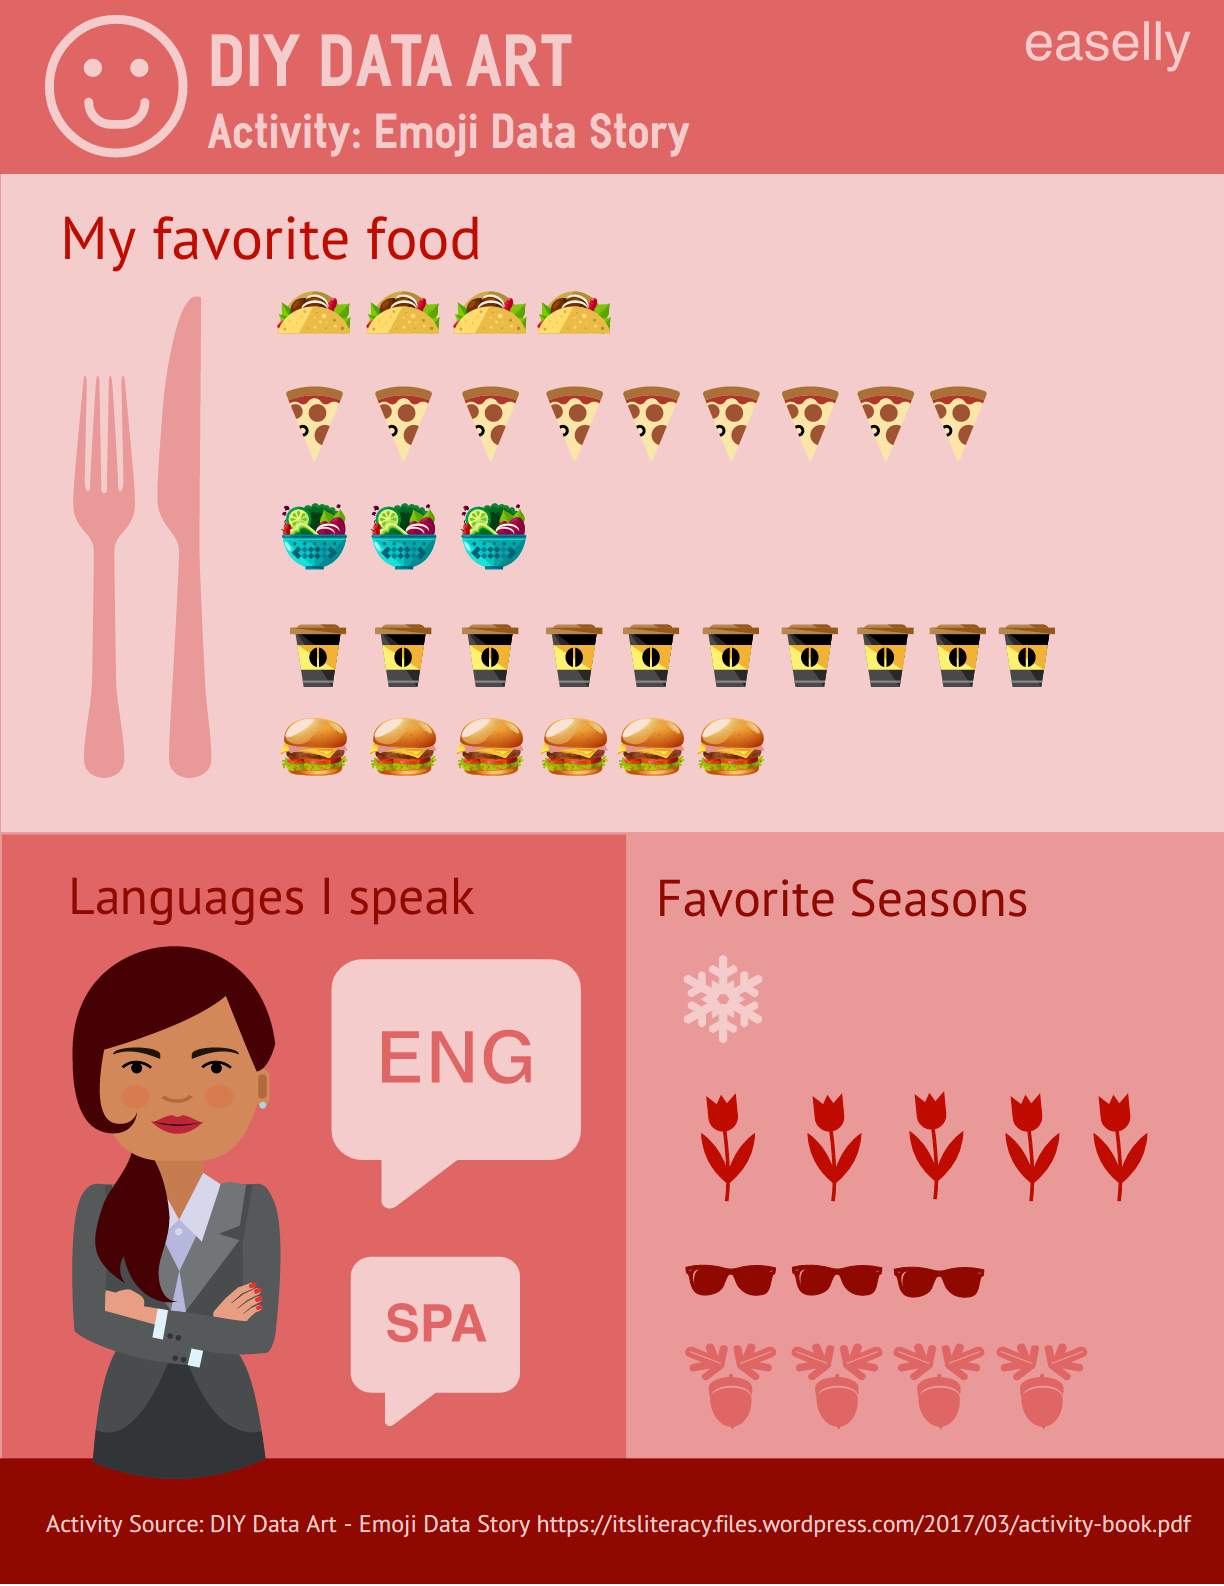
DIY Data Art has a selection of lesson plans and activity worksheets to facilitate data literacy activities in the classroom. To find this lesson plan and activity worksheet, check out the DIY Data Art Activity Guide.
For more lesson plans and activity worksheets to build youth data literacy, visit itsliteracy.org.
—
This post was written by Samantha Viotty. Samantha is a designer, educator and multimedia artist based in Somerville, Massachusetts. Whether it is her role as a project manager, researcher, or curriculum designer, identity and intersectionality are an integral aspect of how she approaches her work. You can find her on Twitter at @sviotty and check out more of her work at samviotty.com.