
As a teacher or educator, you’re probably using visuals aids or a projection from your computer in the classroom. You might even be teaching students how to use a tablet or computer for a research project.
Have you noticed how students respond better when you’re using something visual to entertain and educate?
So what can you do to incorporate more visual aids into your lesson plans, your teaching methods, and your classroom?
Use infographics (of course!).
Infographics are effective in the classroom because they can help with subject comprehension and increase information retention.
Simple infographic examples for classroom subjects
With infographics, you can combine visuals with words in the classroom.
Text-only lessons are abstract and may be challenging for the brain to retain, while visuals can make your lessons a more concrete experience for students, which makes them more memorable.
Not only can you use infographics to teach a specific unit or lesson, but you can also have your students create them on their own for projects and homework to help drive home the content they’re supposed to be learning.
When we say you can use infographics for pretty much anything (and any topic) in the classroom, you may be doubtful, but here are a just a few examples:
Infographics for Math or Algebra
For math lessons, use infographics to help display pertinent information on your classroom wall, in your students’ homework binders, or as part of a study sheet for a test.
Also, you can use infographics to remind students of formulas, break down equations, or share statistical information in a more visually appealing way than reading out of a textbook.
Infographics for English and Literature
Reading and writing are areas where educators tend to avoid visuals during their classes. Yet this is where infographics could help students who struggle with reading comprehension or who don’t like the subject matter.
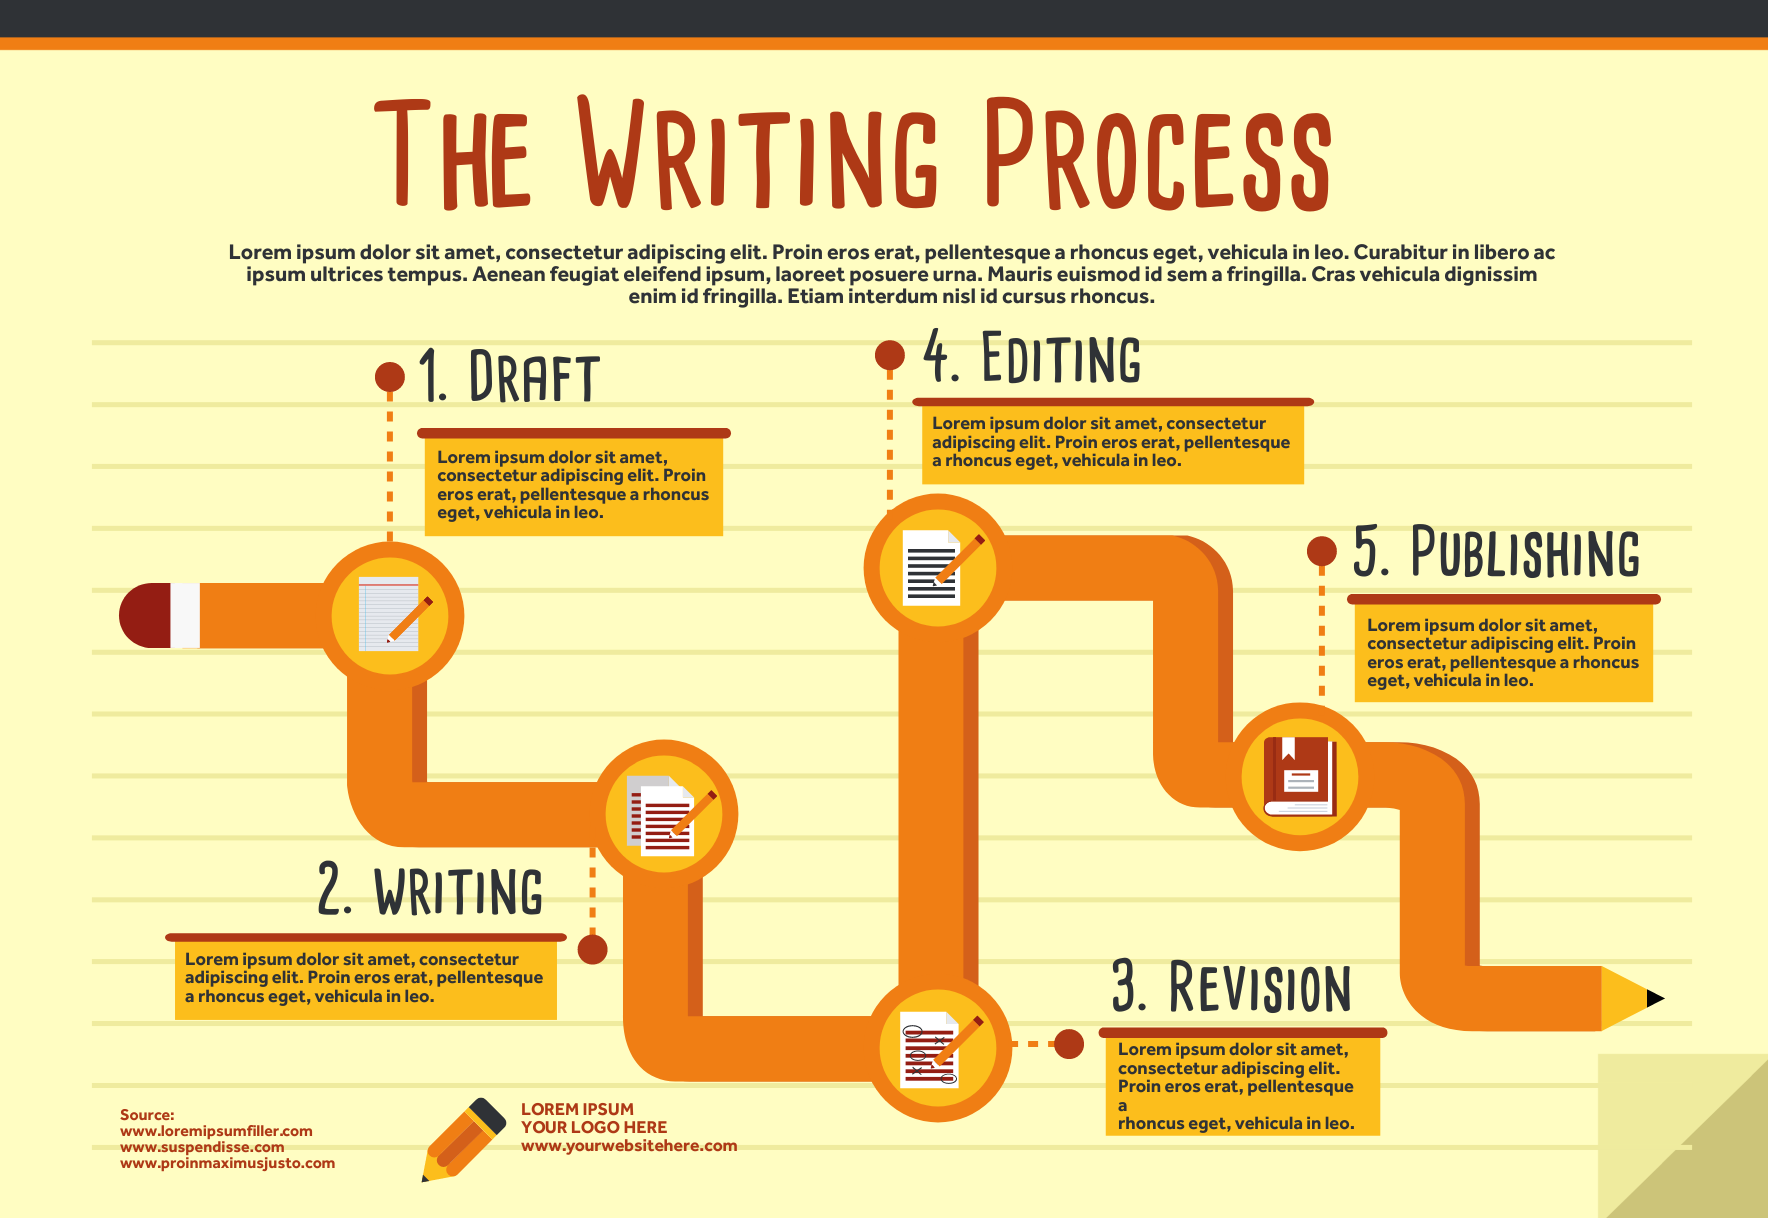
Book reports, homework, plot and theme synopses, and even word breakdowns and definitions can be presented in an infographic format.
As a result, students are more likely to retain what is being discussed in your reading or language class.
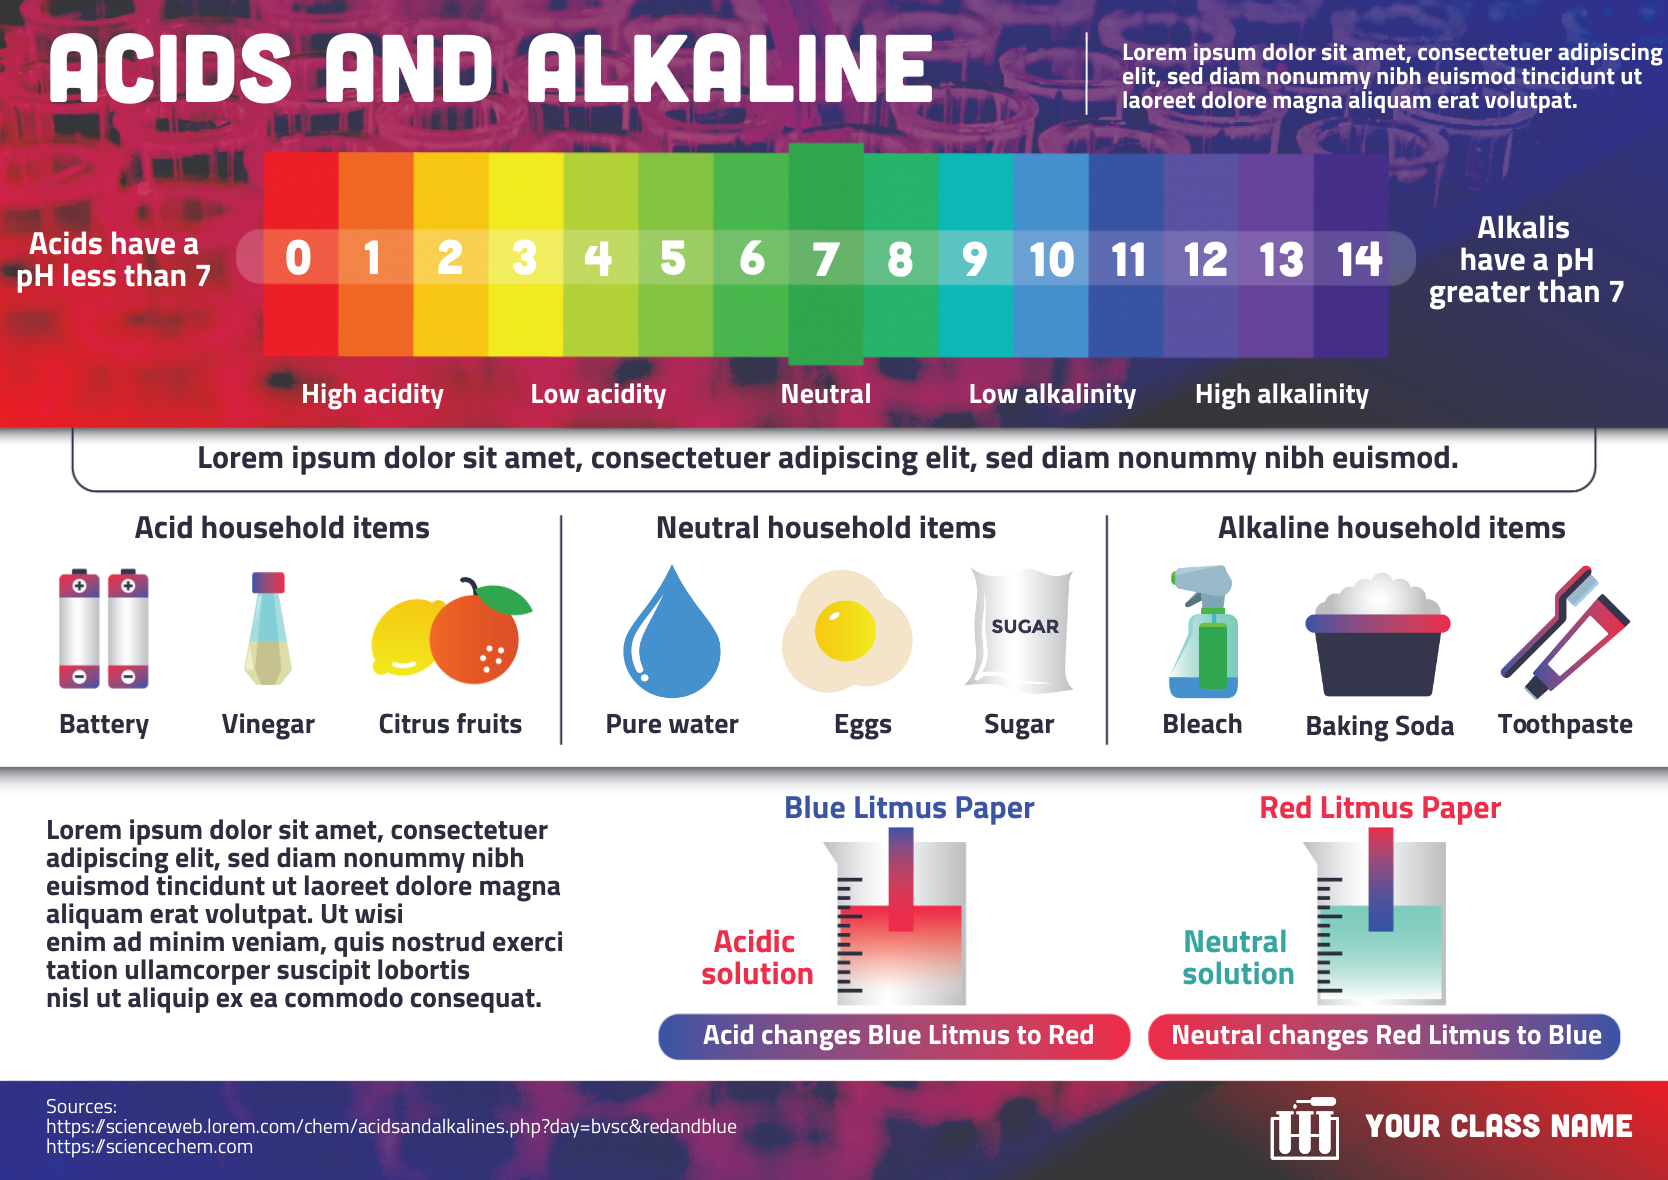
Infographics for Science
Do you think your students can absorb everything you’re saying on the process of photosynthesis, the tectonic plates, cell replication, or the Periodic Table of Elements? Of course not!
Odds are you’ve been drawing diagrams and handing out visual reminders of these processes and scientific concepts for years.
In your way, you’ve already been creating infographics without the digital aspect.
Why not improve the process by creating an extra visually appealing science infographics that students can remember and pull from memory when they need to?
You don’t even have to make one from scratch with pre-made science infographic templates like the one below.
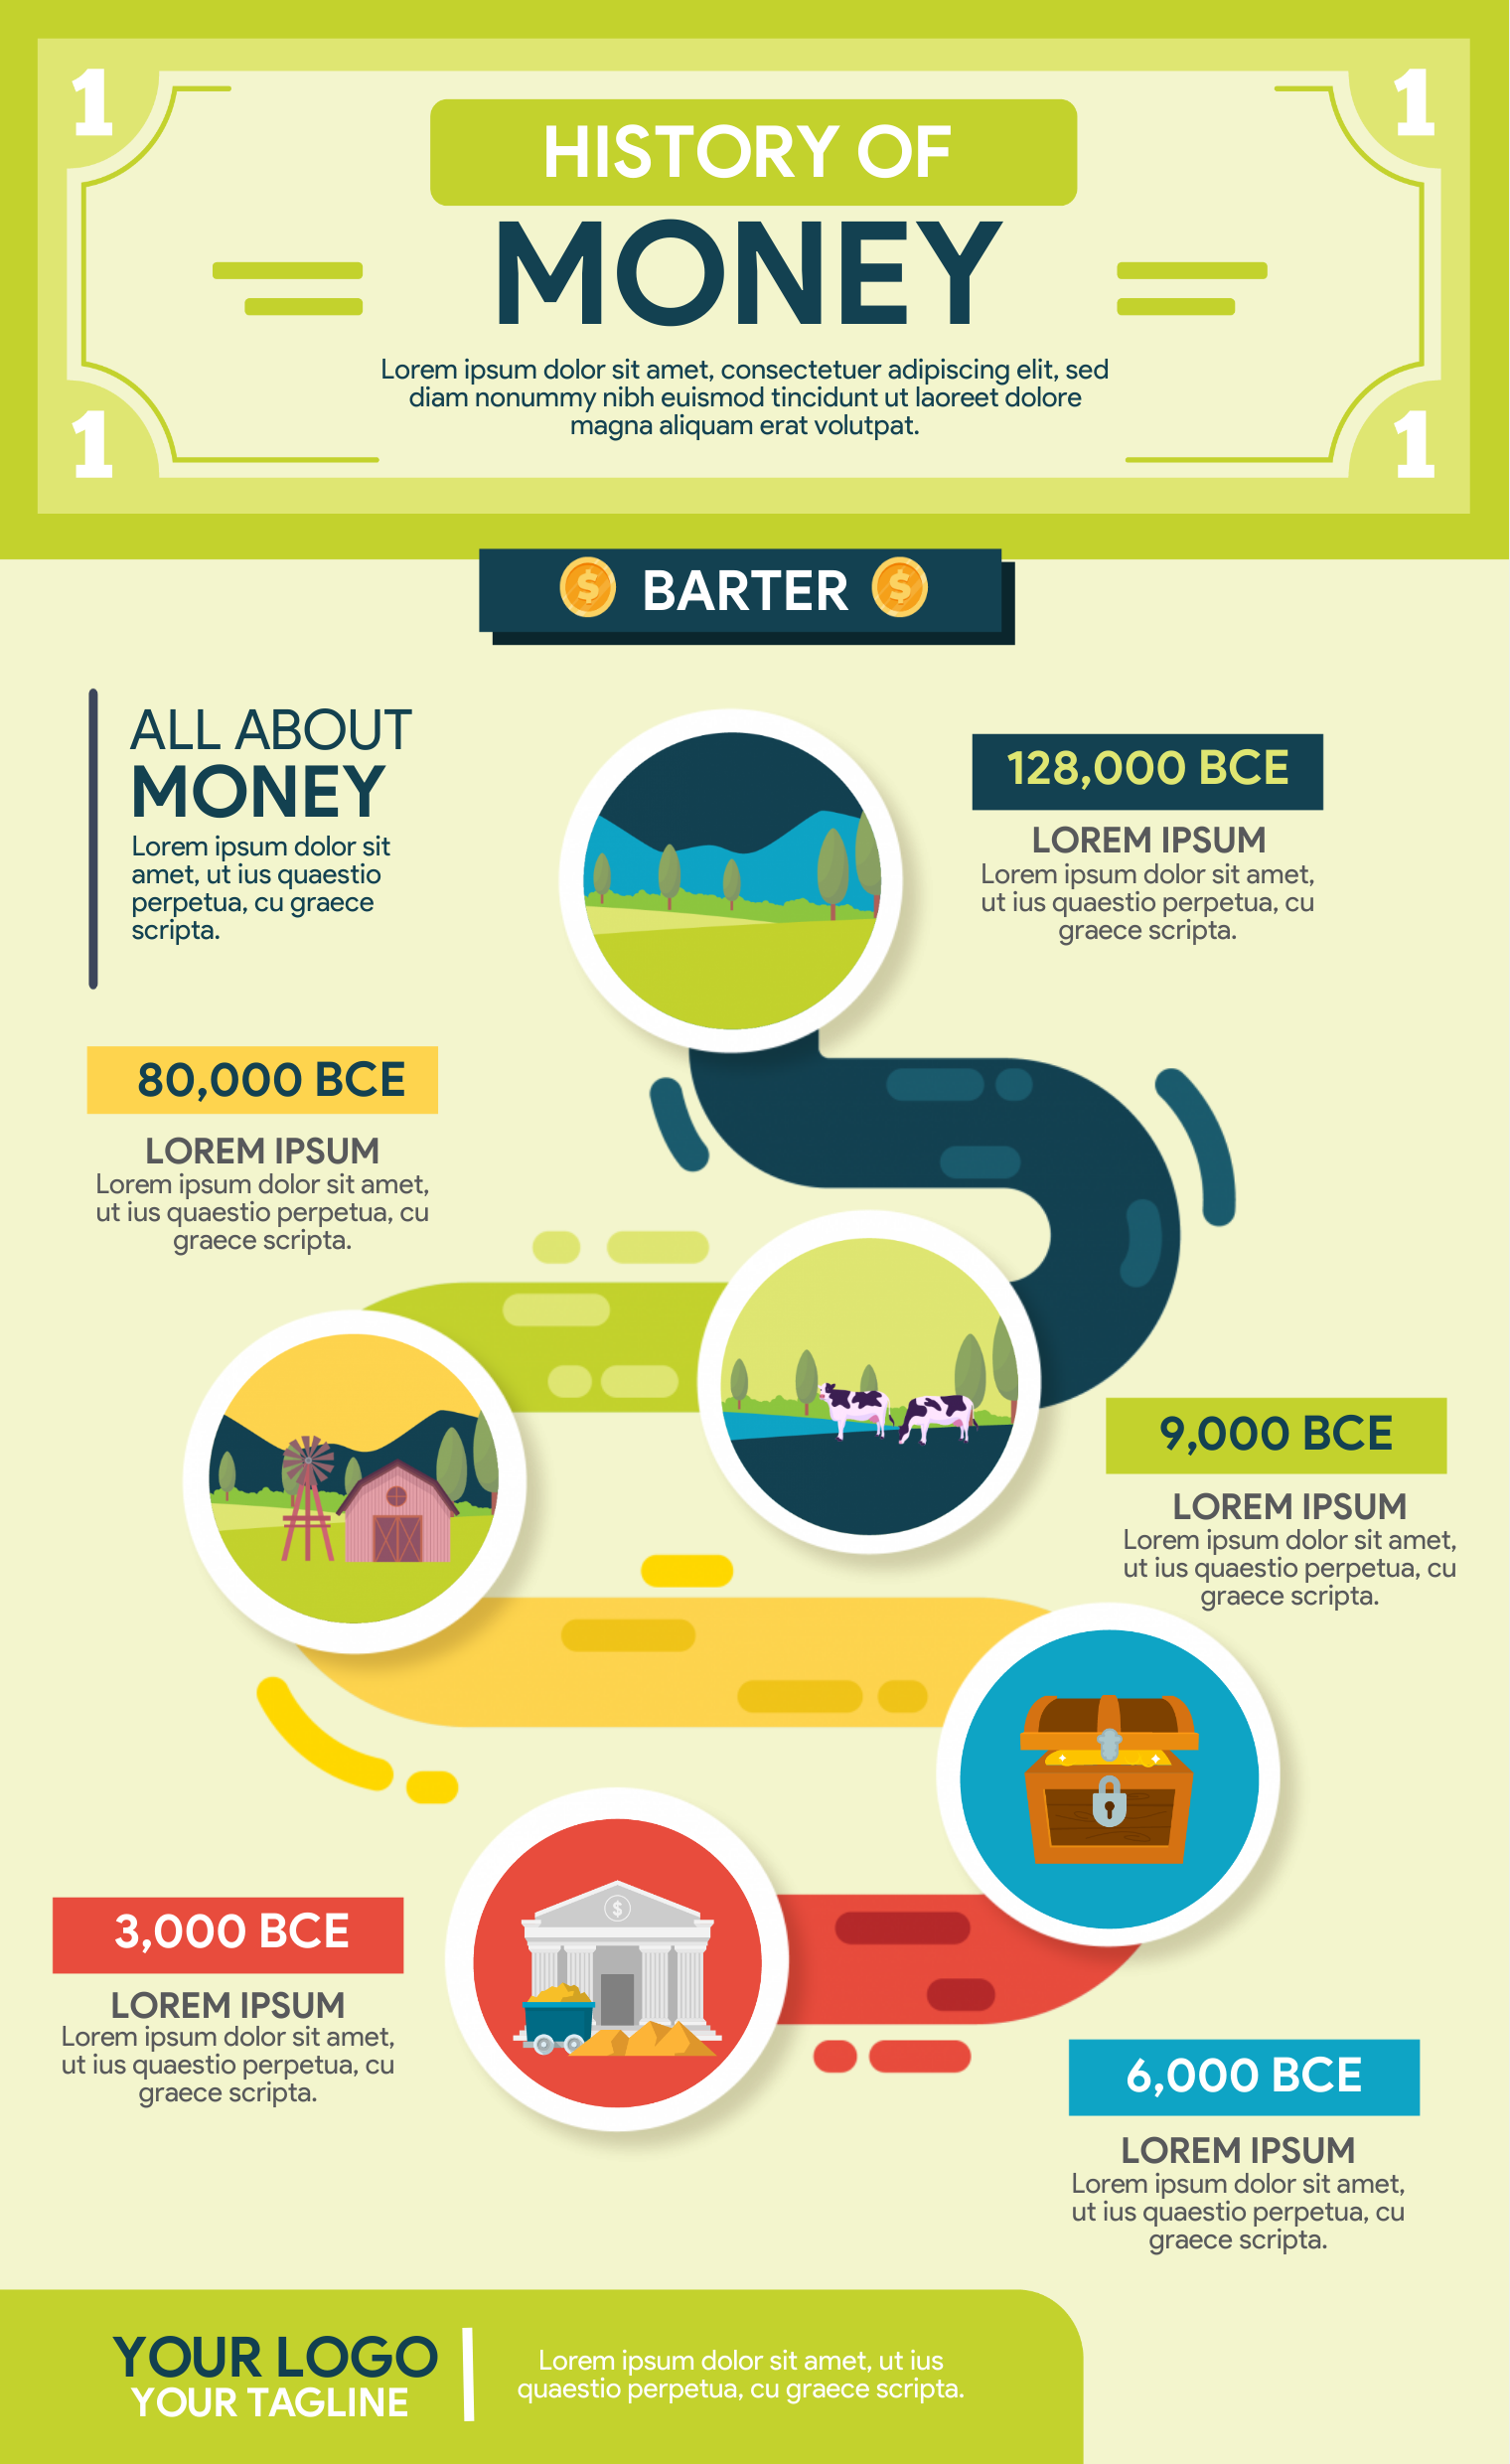
Infographics for History
One of the coolest things about infographics is that they come in so many different formats that you can almost always incorporate any information with visuals.
When it comes to teaching history (probably one of the hardest subjects to get students interested in), timeline infographics are incredibly useful.
It helps students see the progression of an event, how certain things led to another, and the visual reminder of that timeline can help them recall those pieces later on.
You can also get creative by using charts, pictures, and arrows to draw connections between events that would be harder to connect in other formats (oral lecture, written notes, etc.).
Why not incorporate unique visuals to make it easier for your students to recall the information when it’s time to talk about the subject or to take a test?
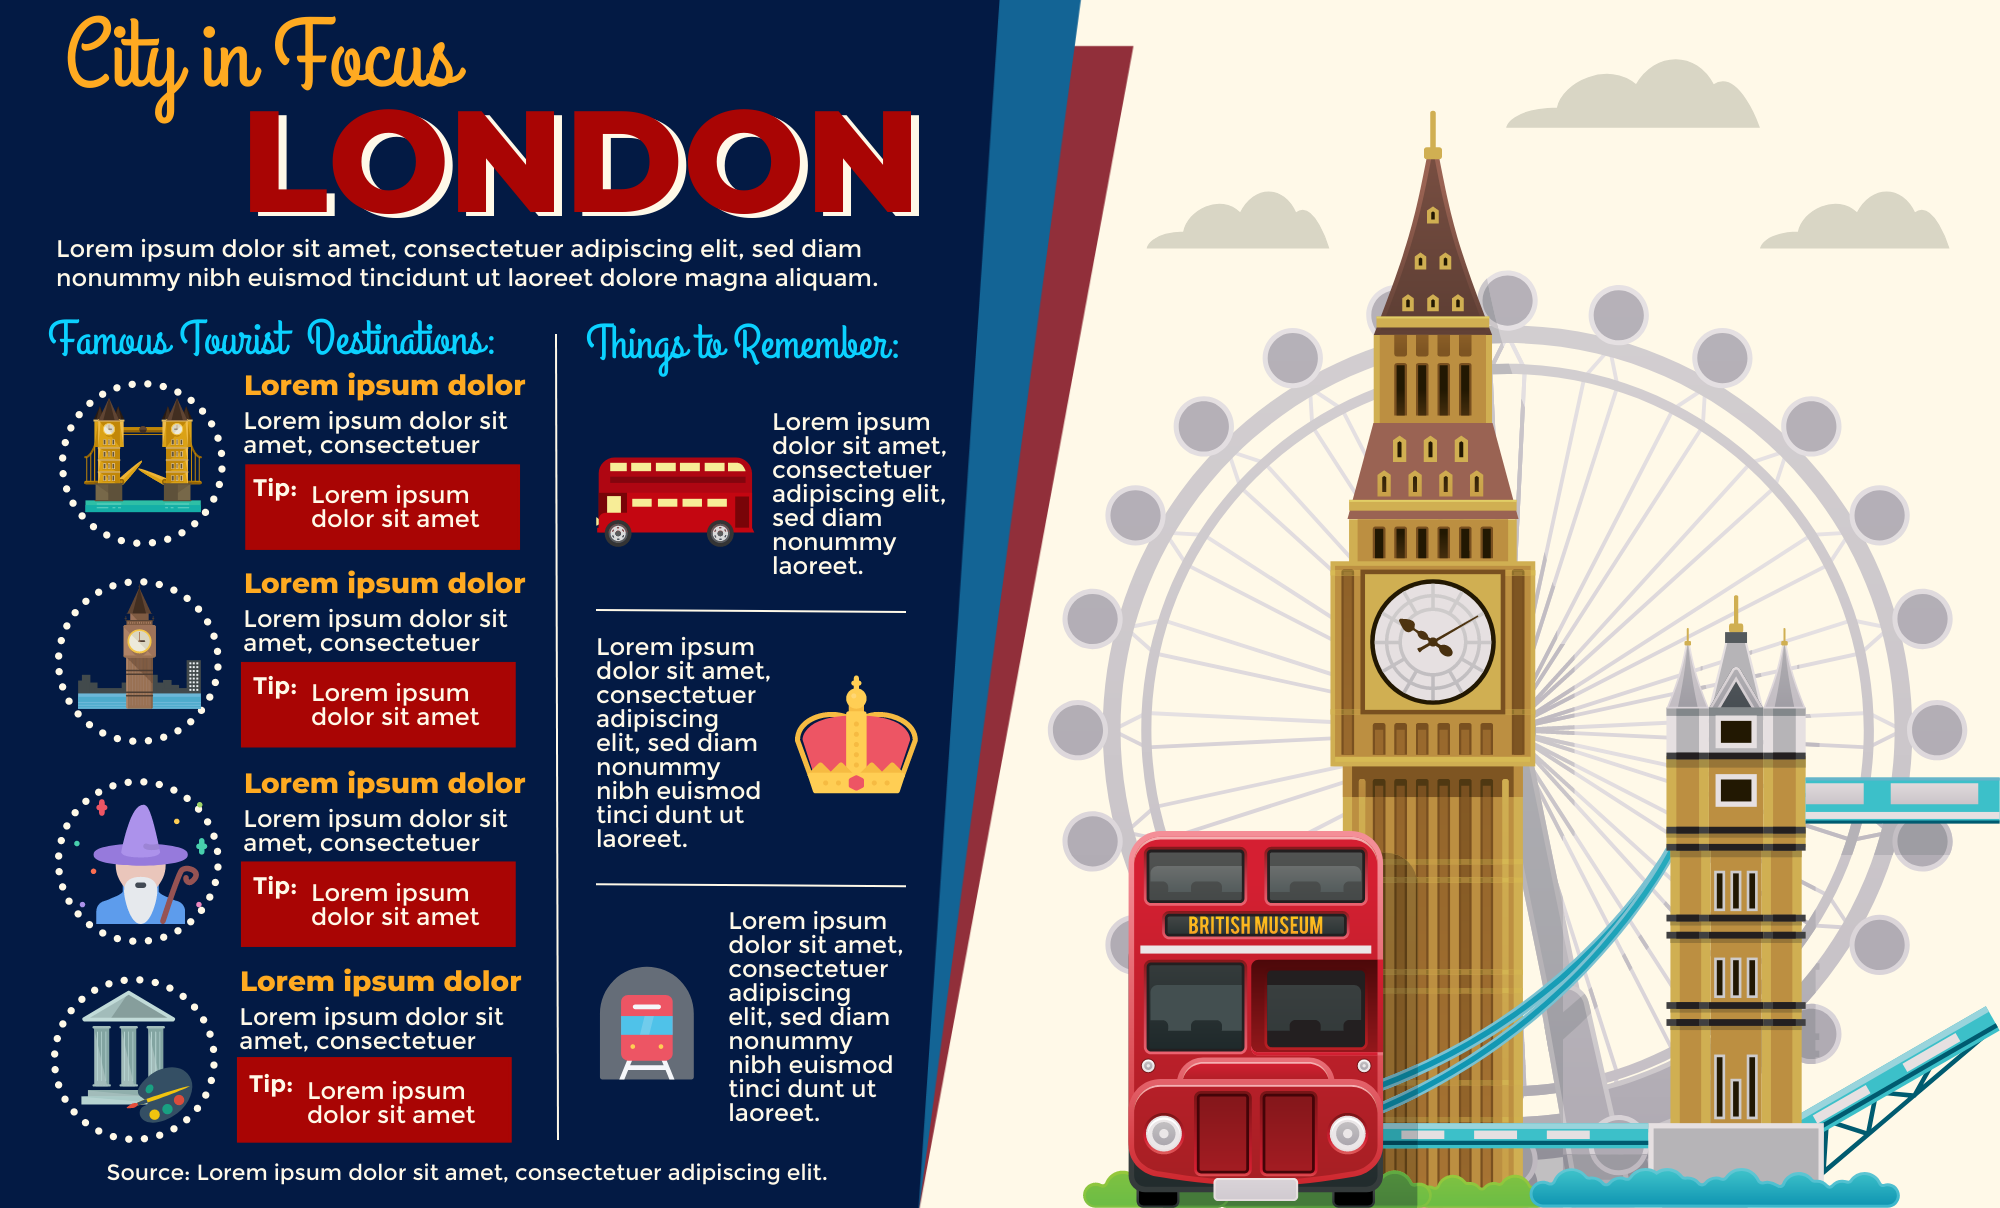
Infographics for Geography
If you would like to brighten up your classroom with striking visuals to encourage deeper learning in travel and geography, infographics are the perfect tools to help translate your data-rich concepts into a straightforward, cohesive narrative.
Infographics for Psychology
Psychology and sociology have always been intriguing subjects for many. For one, humans are social yet introspective at the same time. Such a paradox, right?
For these subjects, there’s almost always a need to visualize information on how our minds work and how we interact with others.
Think of psychology infographics as visual content nuggets that help explain human behavior.

Infographics for Social Studies
When it comes to social studies, politics, economics, and current socio-economic issues, infographics are also ideal teaching aids.
For a start, students can choose to talk about issues reported on the news or look at the two sides of an issue through an infographic!

Teaching your students to make infographics
As an educator, you can use infographics in your lesson plans, handouts, or test review materials. You can print them out and post them around the classroom. Some teachers even use infographics for problem-based learning.
But here’s another excellent idea — teach students to create and use infographics on their own.
If you’re wondering how to help students create infographics, share infographics in a class setting, and figure out how to create impressive images all on their own, download this free infographic activity book for students.
You can also use our infographic design tutorials as good starting points.
Here’s are a couple of short tutorials for your classroom.
10 types of infographics and when to use them
5 infographic activities for students
*Editor’s Note: This post was originally published on July 11, 2016 and updated on May 26, 2020 for accuracy and comprehensiveness.