Have you ever wondered why infographics “go viral” on social media?
Do you want to know why some images work and others just… don’t?
Content creation is the name of the game for many small business owners, entrepreneurs, and marketers, but infographic creation is becoming one of the most powerful tools in online visibility – especially in the social media realm. Because of this, infographic designers and Easel.ly users are seeking insights into infographic impact on social media, and we were only too happy to reach out to an expert to give us real, relevant insights on the subject.
We recently chatted with Donna Moritz of Socially Sorted, a website committed to sharing Donna’s expertise in visual social media marketing and content strategy. (Socially Sorted is a great resource and is also one of Social Media Examiner’s Top 10 Social Media blogs in 2015 and 2016!)
Donna’s article, “Stop Killing Us With Boring Infographics – Do This Instead,” is one of our absolute favorites and provides key insights into making YOUR infographic stand out on social media.

Donna’s speciality lies in understanding the power of social media – what gets shared and what doesn’t. If you’re ready to learn how to maximize your infographics for the ultimate impact on social media, read on!
Get Your Infographic Seen
While many people understand the value of infographic creation (longer audience attention span, easier shareability, and more conversions), they don’t fully optimize their images so they can generate those results!
Imagine drafting that blog post or email campaign and never hitting “Post”!
That’s essentially what you’re doing when you don’t share your infographic in more than one place. Donna agrees, adding that, “…We are seeing that the success of content doesn’t stop simply at the creation of the content in the first place. You need to promote it and give it ‘legs’!”
Don’t limit your content promotion to your blogs, videos, or podcasts; include your infographics in similar marketing efforts. Donna recommends embedding your infographic FIRST into your core content (a long form blog post for example), and then sharing. Because infographics can “go more places” than blogs or written content, statistics are showing that infographics are performing better than blogs – but only when they’re shared!
Donna makes a great point when she says, “…Visitors to your website are looking for visual content to share (to Pinterest and other social media sites). And we are also conditioned to “click through” on infographics from sites like Pinterest, so it’s important that you give users excellent landing content to arrive at when they do.”

But your infographic promotion doesn’t stop there! There are many ways that infographics can be easily promoted on social media beyond your blog and Pinterest.
How to maximize your infographic reach
Here are just a few of Donna’s ideas for maximizing your infographic reach:
- Post regular tweets to your post/infographic on Twitter. TIP: Include the hashtag #infographic or something trending in your niche to help with discoverability.
- Share the link to your blog or content to Facebook, and then share the infographic JPEG or PNG directly. TIP: This works best if the infographic is not super long. You can chop up a larger infographic into social media-friendly sizes.
- Utilize LinkedIn by using their individual publisher. Include your infographic, some of the original post, and a link to your website!
- Create a short video to post on Facebook or Instagram to announce your new post and infographic. Facebook Live is becoming really popular for expanding on content ideas and getting people engaged and Instagram just introduced Stories!
- Create smaller images using elements of your infographic. This could be tips or quotes that will entice people to check out the original infographic from Facebook, Instagram, or Twitter (like we did with the image above!).
- Optional: Once your infographic has been viewed on social media and has driven traffic to your site, you can also upload it to SlideShare or submit it for approval to Infographic directories.
For a lot of users, this can seem overwhelming and maybe even excessive. But Donna says that all efforts you put into “giving your infographic legs” will help your content, website, and services or product get loads of visibility!
“Remember, once you create an infographic, it’s a piece of visual content that can potentially drive traffic to your website for months and even years down the track…. so it’s worth it!”
Get Results
Throughout our interview with Donna, she made one thing very clear: the work you put in directly correlates to what you get out of your infographic. While creating an infographic that looks great will attract attention, optimizing that image will get conversions and grow your business.
Did you know that tweets with images get retweeted twice as often, while 19% of active Pinterest users say they make a Pinterest-inspired purchase at least monthly?
On top of that, companies that create custom visual content have a 7x higher conversion rate.
So really, visuals = growth any way you look at it.
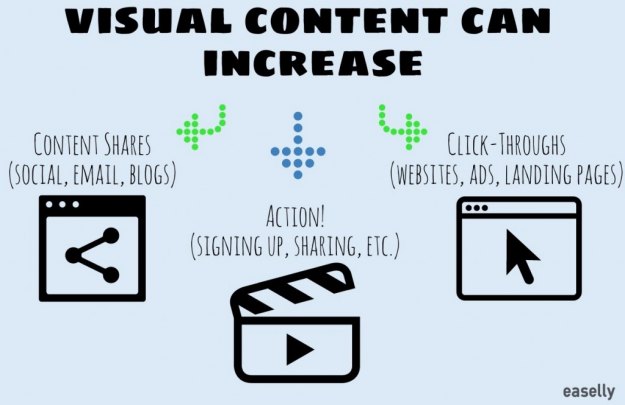
If you’re ready to get more conversions in the form of:
- Content shares via social media likes/follows/retweets, email, blogs, etc.
- Click-throughs to your blog or website from the visual or infographic.
- Taking action – i.e. doing something based on the content of the visual or the description or link. It could be to subscribe to your email list, sign up for a webinar, or to read a blog post and comment.
… then you need to optimize your infographic content! This means that it needs to look great, be relevant, be digestible, and make your audience MOVE!
Here are Donna’s FIVE criteria for creating conversion-friendly infographics:
1. Make them original
Original images and videos catch attention. We like to be the first to share original, eye-catching, helpful content. Be the minority that creates original visuals for the majority to share.
2. Make them timely
There are two ways to create timely content:
- Create content quickly in response to an event or news or even a hot topic that is trending
- Plan ahead to create content for an event, celebration, or milestone that is coming up.
We recommend taking a look at major holidays, events within your organization, or peak times for your business – they all serve as great “timely” content ideas!
3. Make sure they’re relevant
Donna says, “Aim to post “native” content suited to the platform you are on, whether it is Instagram, Facebook, Pinterest, Twitter, YouTube, Snapchat or something else.”
4. Make “snackable” images
“An infographic that is 1500 or 2000 pixels in length can be just as powerful as one that is 5000 pixels in length,” says Donna. “It’s important to be posting some “snackable” content that is easy to process, and easy to engage with.”
5. Include a Call to Action
Whether it is a link in the description, a call to action, or a link within the image itself, the key to conversions is knowing what you want people to do and giving them a call to action to do it.
Donna adds that users should “craft their content so that people understand what they should do with the content – is it to just consume it? Or share it? Or click through to another platform? Should they sign up for an email list or visit a landing page?”
Donna goes into more depth on each of these points in her great article, “The Secret Sauce to Shareable Content.”
Now that you know how to optimize your infographics, it’s time to start seeing results! If you’re already in the middle of your current visual campaign and just not seeing the results you want, Donna has a few insights for you!
Not Getting Results From Your Infographics?
Many infographic creators make the mistake of thinking that just any visual is going to drive in tons of traffic. The reality is, though, that people want to see something they’ve never seen before – and they want it to look good!
When we asked Donna about what small business and entrepreneurs could do to make infographics that really WOW, she broke it down for us:
“Firstly, the key is to make the infographic easy to process, and not too busy or overwhelming to look at. The last thing you want to see on an infographic is so much text that it should have been a blog post in the first place. Loads of text is not the point of an infographic – visuals are.”
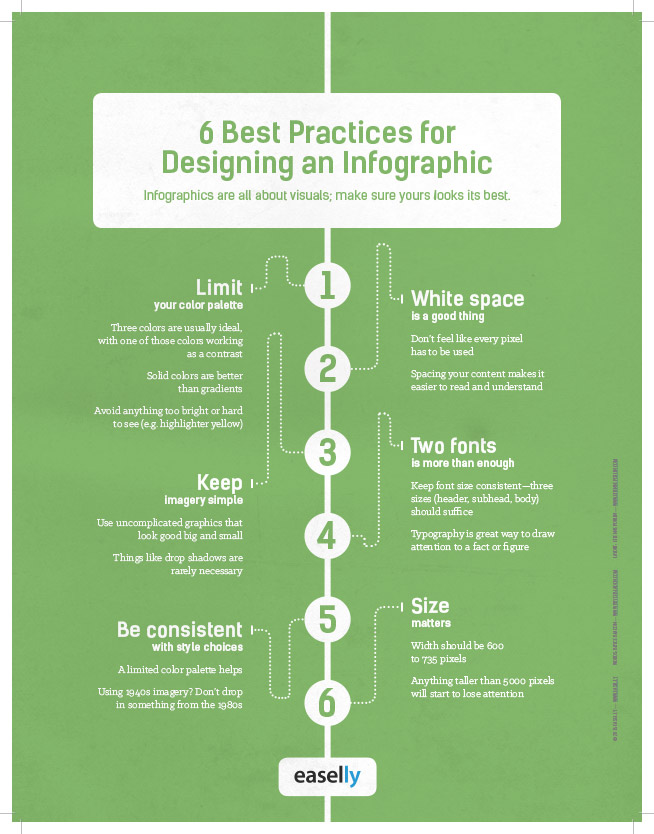
Donna recommends that infographic creators:
- Use only 2 or 3 fonts and colors – otherwise it gets distracting!
- Embrace the white space! You don’t need images and text all the way to the borders!
- Keep it short. If you do create a long infographic, use segments or sections, headings, color, and sizes of images to create visual flow.
- Keep it interesting! People aren’t always looking for data, sometimes they are looking for help. Make sure your data matters before visualizing it. And don’t bore people!
- Keep the story simple – focus on one core message and share it visually. If your data doesn’t stay on script, don’t use it!
- Don’t follow the rules. The reality is that there are no rules with infographics. You are only limited to your creativity!
Most of all, have fun!
Donna’s main message in her work with social media and content is that your audience wants to see something they don’t get somewhere else. Think about all the stock photos you’ve seen scrolling Pinterest or Instagram – not exciting!
But think about the last time you saw a visually-dynamic, interesting, and “snackable” image – pretty fun, right?! Donna’s company has created successful infographics on a variety of topics, from a representation of a Linkedin profile to fun guides to timelines.
Create infographics and images that are unique, useful, and optimized. In no time, you’ll have more social impact, higher web traffic, and more conversions than ever!
A big thanks to Donna Moritz of Socially Sorted for her amazing advice and generosity! Follow her on Twitter @SociallySorted to get all her updates and subscribe to her blog at www.sociallysorted.com.au/blog. You can also find her FREE video training on creating visuals at www.sociallysorted.com.au/free-training.