In the States, it’s the start of the Back to School season!
If you’re a parent, you’ve probably already hustled through the store aisles trying to find those pencils, notebooks, and backpacks. If you’re an educator, you’ve probably spent the better part of your summer gaining new knowledge yourself, training for new district standards, and creating awesome lesson plans.
Many of our educational users – teachers, educators, homeschoolers, and even school districts – have also started emphasizing EdTech in their summer trainings, lesson development, and the like.
One EdTech aspect that we’re quite familiar with here at Easel.ly is the push for visual learning in (and out of) the classroom. Education no longer looks like it did when we were younger; teachers are moving away from textbooks and moving more towards unique types of engagement. Even Common Core structures are helping to foster an environment where visual communication and representation of information is commonplace.
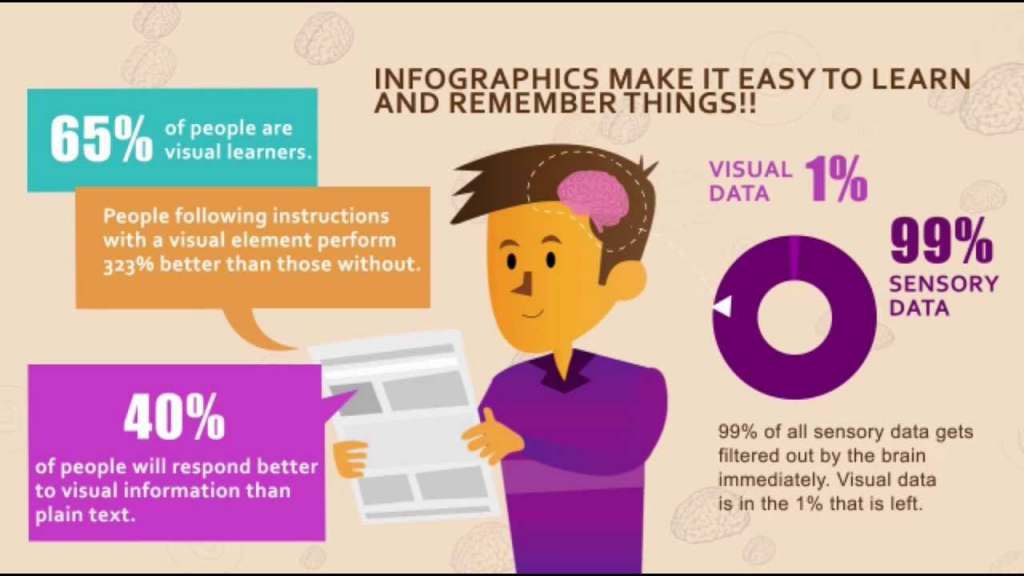
As you can see in the infographic above, 65% of people (your students!) learn through visual input, and visual data is actually retained longer. So what does this mean for your classroom?
Embracing the Visual Frontier in Education
As a teacher, whether you’re freshly graduated or a seasoned vet, you know that adapting to your students’ needs is the most important part of your career. In today’s digital world, students are more engaged on a visual level than ever before, which means that reading from a boring old textbook just isn’t going to cut it. It also means that you have to “hit home” for your students, and use creativity and innovation to really get through to them.
On top of that, new requirements from the Common Core curriculum emphasize the use of multiple modalities to demonstrate learning. Students don’t just take notes and then take a test anymore; they have to show that they’ve absorbed what they’ve learned by reiterating it in a few different ways.
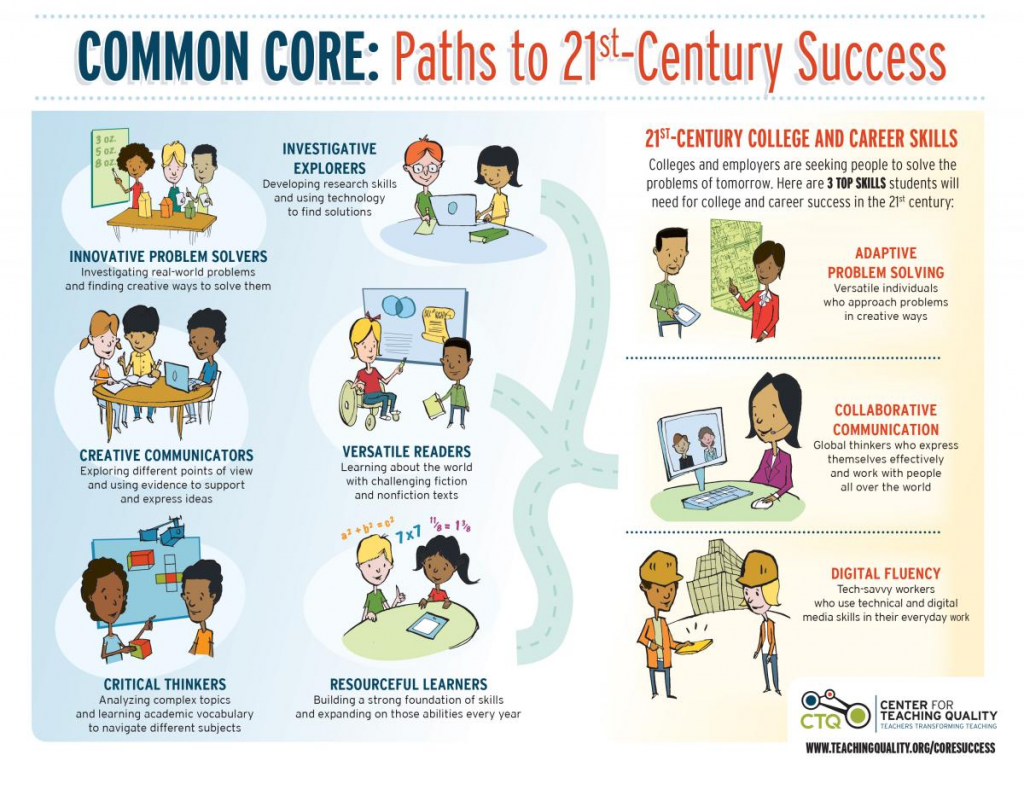
According to the Common Core State Standards, students have to demonstrate competency by:
- Integrating visual information (e.g., in charts, graphs, photographs, videos or maps) with other information in print and digital texts.
- Integrating and evaluating content presented in diverse media and formats, including visually and quantitatively, as well as in words.
(That sounds like a job for infographics!)
What better way to meet CCSS than by utilizing tools like Easel.ly to help students interpret information, visually retain it, and work with technology in new ways?
Why Use Infographics in the Classroom?
We talk a lot about the statistics behind visual data here on Easelly, and if you’re interested in reading up on just how important and versatile visual learning is, head on over to Infographics for Every Subject.
But the statistics are just one part of the visual learning movement. Teachers are also finding that their students are more engaged when they are visually entertained, and actually enjoy creating their own visuals to represent what they’re learning.
Teachers and educators aren’t limited to creating and using infographics to teach students – students can teach and share their own infographics to demonstrate CCSS benchmarks and be entertained at the same time. The classroom dynamic is changing, and students are on the front lines of an entirely digital world.
Infographics are becoming quite the tool in a number of places, from the classroom to the boardroom and anywhere in between. The reality is that displaying information in succinct and creative ways is the information carrier of the future. Give them the tools to demonstrate what you’ve taught them, and also give them tools to prepare them for the future.
Resources to hit the CCSS benchmarks
If you would like to see just what you can do with Easelly’s infographic maker tool to help your students hit the CCSS benchmarks, check out our awesome Reading Information and Reading Literature Standards:
- Reading Information Standard 1
- Reading Information Standard 2
- Reading Information Standard 3
- Reading Literature Standard 1
- Reading Literature Standard 2
- Reading Literature Standard 3
- Reading Literature Standard 4