Nonprofits

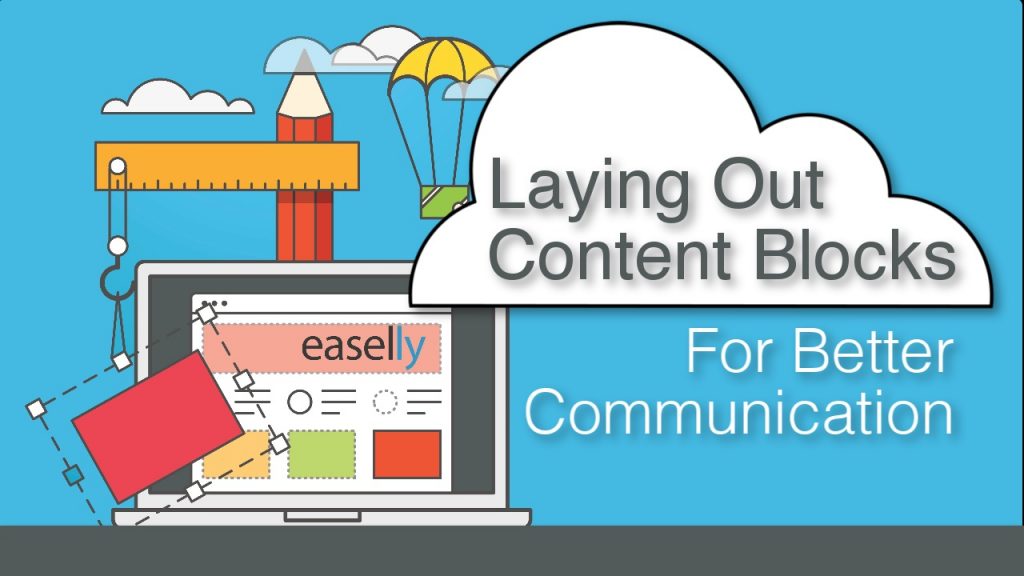
Video: Laying Out Content Blocks For Better Communication

In this tutorial, we’re going to talk about laying out content blocks for better communication. Layout will play an important role in your infographic designs. Layout refers to the way elements are arranged on a page when it comes to the placement of text, images, and style. You can use content blocks in your layout …

Video: Laying Out Content Blocks For Better Communication Read More »
NEW Infographic Design Service

VIDEO: Easel.ly’s NEW Infographic Design Service

We know you’re busy. Whether it’s with your business, customers, students, family, or your personal life, we all have a lot on our plates. We at Easel.ly also know that creating an infographic to promote your business or ideas can be time-consuming; something that is always in short supply. If you’re new to infographic design or …

VIDEO: Easel.ly’s NEW Infographic Design Service Read More »

Webinar Recap! 10 Ways to Crank Up Your Infographic Design & Productivity!

We held a LIVE training on “10 Ways to Crank Up Your Infographic Design & Productivity,” and it was packed with straightforward and practical steps to get you started with the Easel.ly designer and make sure you are making the most out of Easel.ly! We also touched on easy ways to get started using Easel.ly’s …

Webinar Recap! 10 Ways to Crank Up Your Infographic Design & Productivity! Read More »

make great infographic

VIDEO: Make Your Audience Fall in LOVE With Your Infographic

What’s the ONE thing you need to make your audience, students, or clients love the infographics you create? It’s our best-kept secret… are you ready? A story. No, it’s not amazing design, it’s not perfect icons, it’s not the alt tags or image SEO. It’s the story you tell with your infographic. Bet you didn’t …

VIDEO: Make Your Audience Fall in LOVE With Your Infographic Read More »

Crash Course In Infographics Live! Webinar Recap!

Today we held Crash Course In Infographics – LIVE, and it was packed with straightforward and practical steps to get you started with infographics! We also touched on easy ways to get started using Easel.ly’s design tool, from using templates, to inserting images or media, and ways to share your infographic. For the complete reference, …

Crash Course In Infographics Live! Webinar Recap! Read More »

Unique Ways to Use Easelly

More Than Just Infographics: 6 Unique Ways to Use Easelly

Many of our users love our awesome infographic templates, objects, and hyperlinking features. We are one of the most popular online infographic creation tools because of this, but we’d like to highlight a few other functions of our infographic maker tool so our users can get the most bang for their buck. Depending on your …

More Than Just Infographics: 6 Unique Ways to Use Easelly Read More »

Photo with Black Friday sales

Black Friday Mania: History, Fun Facts, and its Future

Most people around the world are now familiar with the shopping phenomenon that is Black Friday. Many of us, in the United States especially, wake up bright and early (or don’t sleep) to attend sales that start at 6, 5, even 4am on the Friday after Thanksgiving. But do you really know what Black Friday …

Black Friday Mania: History, Fun Facts, and its Future Read More »

Data and Infographics: Solving Problems for Your Nonprofit

There are times when visuals just speak louder than words. Whether it’s a picture of people being helped or a colorful chart showing the total amount of funds raised, visuals have always struck a chord. Nonprofits and relief organizations have always known this, which is why their promotional and marketing materials usually have photos of …

Data and Infographics: Solving Problems for Your Nonprofit Read More »

How to Collect Your Own Data: An Interview With Max Galka (Part 2)

As we mentioned in Part 1 of our interview with Max Galka, data visualization has become one of the biggest trends of 2016. Not only do we have more access to more information than ever before, but we are able to collect that information (data) in all new ways. But of course, we don’t just …

How to Collect Your Own Data: An Interview With Max Galka (Part 2) Read More »

Information, Visuals, and Collecting Data: An Interview With Max Galka (Part 1)

We recently spoke to Max Galka, an entrepreneur and blogger, whose main focus is on the world of data. Galka is known across the Interwebs as a data visualization genius as well as a data pioneer, working on projects that visualize information in truly colorful ways. His latest project, Blueshift, focuses on creating interactive, data-driven …

Information, Visuals, and Collecting Data: An Interview With Max Galka (Part 1) Read More »

infographics for e-courses

Another Way to Use Infographics: E-Courses!

“Infopreneurs” are a new class of entrepreneurs providing their knowledge and expertise through e-books, email series, and e-courses. As anyone who has ever designed, created, and launched an e-course will tell you, half the battle is coming up with great content that people just can’t resist (and will pay for). The other half of the …

Another Way to Use Infographics: E-Courses! Read More »

Scroll to Top