Creating Infographics

collecting data

How To Get Maximum Impact From Your Nonprofit’s Data: Part One

If you run or work for a nonprofit, you know the constant need to grow your reach, expand your network, and make more of an impact. While you may see the impact that you’re having on the people, places, or environment you’re trying to help, it’s often hard to quantify that information to share with …

How To Get Maximum Impact From Your Nonprofit’s Data: Part One Read More »

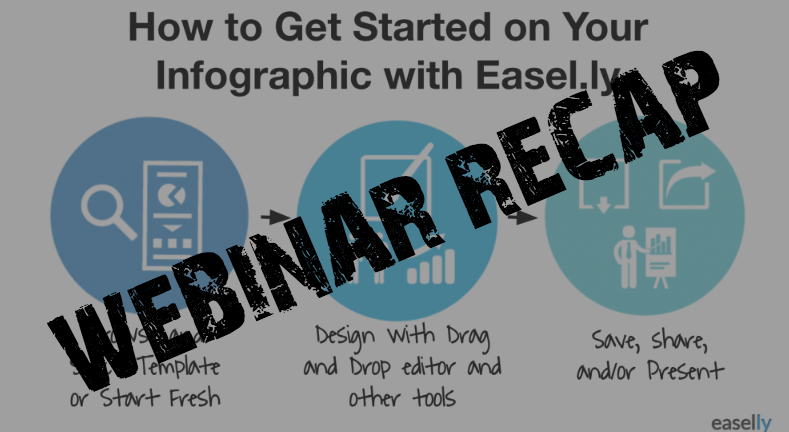
Webinar Recap: How to Easel.ly Create Your First Infographic

Today we held a LIVE training on How to Create Your First Infographic using Easel.ly and it was packed with straightforward and practical steps to get you started with the Easel.ly designer! We also touched on easy ways to get started using Easel.ly’s design tool, from using templates, to inserting images or media, and ways …

Webinar Recap: How to Easel.ly Create Your First Infographic Read More »

draft infographic

Technical Tuesday Video: Why You Need a Rough Draft Before Creating Infographics

How often have you opened Easelly’s infographic maker tool with the intention of finding the perfect template to jog your ideas? Or how long have you stared at the template trying to figure out what you’re going to do? To save time and sanity, you NEED to create a rough draft before you start creating. …

Technical Tuesday Video: Why You Need a Rough Draft Before Creating Infographics Read More »

easelly fonts

Technical Tuesday Video: The Importance of Font

What is the first thing you notice about an infographic? Odds are you are attracted to the color and shapes more so than the actual text on the image. Visuals are preferred over text by most content consumers, but infographic creators still benefit from 3x more engagement on their social media and websites. So what …

Technical Tuesday Video: The Importance of Font Read More »

Four Ways Internal Operations and Infographics Go Hand-in-Hand

You know those really boring internal emails you get? Or the packets of budget information you have to print off, hand out, and then never read at the end of your fiscal year? What if you could cut out the middleman (the printer, your email, that pointless meeting) while still relaying necessary information to your …

Four Ways Internal Operations and Infographics Go Hand-in-Hand Read More »

Jump on the Infographic Bandwagon (Before It’s Too Late)

If you’re responsible for any type of content marketing, whether it’s for a small dental practice, a large marketing firm, or anything in between, odds are you know the power that visuals have. We all use thumbnail images, blog header images, and graphics scattered throughout our emails or blog posts. But infographics have a special …

Jump on the Infographic Bandwagon (Before It’s Too Late) Read More »

Class Rules: Infographics for Every Teacher

School is out for the summer (in the United States at least), but that doesn’t mean teachers aren’t already gearing up for the next session. If you’re a teacher and you find yourself already bogged down in lesson plans and deciding how best to organize your classroom, here are a few ways that infographics can …

Class Rules: Infographics for Every Teacher Read More »

Using Infographics In Lieu of Web Copy

As a startup, small business, or even a more established company, there is a lot of emphasis placed on the quality of your website and the content therein. In the “Digital Age,” people Google your business name to see what you’ve got before they decide to invest in your services, product, or message. Obviously, you …

Using Infographics In Lieu of Web Copy Read More »

Using Infographics to Teach the (Real) History of Cinco de Mayo

Cinco de Mayo, more commonly referred to as Cinco de Drinko, is a Mexican holiday celebrating the Battle of Puebla, a small city in Mexico. No, it’s actually not a holiday dedicated to drinking copious amounts of margarita mix. Shocking, right? Well in case you were wondering how to actually demonstrate the history behind this …

Using Infographics to Teach the (Real) History of Cinco de Mayo Read More »

11 Activities Using Infographics & Data to Teach The Election

Are you using infographics to explain or teach the election? If not, you should be. The election is a treasure trove for infographics and data representation.  There are so many things to analyze during election season–candidates, issues, numbers, polls, statistics–this is the infographic lover’s jackpot. Without visuals, we surely would drown. The 2016 election is …

11 Activities Using Infographics & Data to Teach The Election Read More »

Infographics for Teaching Classic Literature

If you’re the English teacher or drama coach, you’re probably pretty up on your Hamlet and MacBeth. The rest of us–not so much. These works can be pretty daunting for students and mere mortals alike. Even with Sparknotes, Thugnotes, and reading Amazon reviews, the classics are tough to understand. They’re classics for a reason. Students …

Infographics for Teaching Classic Literature Read More »

Scroll to Top