One of the hardest parts about owning your own business (or starting one from scratch) is knowing what your audience wants. Of course, we’re not all clairvoyants, so maybe we should stop guessing and start asking. Polling your customers or audience can go a long way in not only giving you the data and answers you need, but building support from your community. In an ideal world, we provide the products and services that our customers are willing to pay for without wasting our time or energy on things they don’t want. That process starts with collecting data.
How to Poll Your Customer Base
At the thought of polling, the image of voting tickets and counting ballots might come to mind, but that’s not the only way to collect information today. A poll can take many forms, and can also depend on the size of your business or operation.
If you’re in startup mode and trying to hammer down your exact audience, polling could take the form of emailing your contacts to gauge interest in your specific product. If you’re in launch mode, polling could be seeing how many pre-orders you can collect on your online store. If you’re trying to expand, asking your audience on social media “Which location should we move to next?” could be a great option.
You can send email satisfaction surveys, asking “How much did you enjoy your last order?” or “How likely would you be to recommend us to a friend?” Asking questions about your customers’ or audience’s preferences, their results with a specific product, or what they enjoy most about your services or products will help you a lot.
On the upside, polling your audience has never been easier, with email campaign software, Twitter polls, survey software, and tons more. But are you wondering why anybody would want to respond to a poll? After all, people are too busy to take time out of their day to answer a few questions, right?
Your Audience Will Respond to Polling
We all try to avoid doing a favor for someone without any hope of a return; it’s human nature. So why would you expect your audience or customer base to respond to a few questions that help you and not them? Because you’re providing a service or product that they are paying for, and they will want that product or service to be the best it can be. Also note that if customers love anything, it’s being heard.
Customers who feel heard and who feel that their opinions are being taken into account are more likely to support a brand or business. Asking customers questions about their experience, or even personalizing your service based on what they’ve said they want, can increase your sales, help your business expand, and will create a loyal customer base.
But why the polls? Why not just ask questions from individual customers and see what happens? Because you can take the information from your polls, collect it easily, implement the findings, and even create some awesome data visualizations that you can use for marketing and internal education purposes. Put simply, you can make pretty infographics with the data you collect!
Why Turn Your Data into Visuals?
You’re probably thinking, “I’m not going to make an infographic out of my customer poll. I’m just going to use the information to help me grow my business!” – and that’s a great thing to do. But when you take a set of data and put it into a visual like an infographic, you can also use that data as a marketing tool, for employee training, in investor materials, and even to position yourself as an authority in your area! How?
Take this infographic below. This company polled their audience on these questions, but then created an infographic that is useful for a number of other companies and audiences. Why would you waste your time, money, and energy on polling if it benefits other people, too?
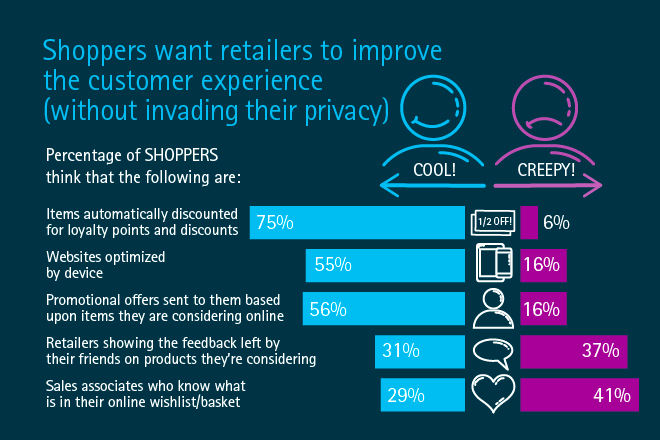
The answer is twofold:
- You can embed links back to your landing page. This means that when your image gets shared, you’re actually going to get traffic as people click-through. Bonus!
- People are going to see your business or brand as an authority on this customer experience topic and search your content for more information. This leads to a larger audience, more conversions, and a growing business!
You can also use your polling visualizations as marketing tools, social media images, and as a way to get more people to engage. Take the infographic below, for example. This company polled their audience and created this cute little infographic with their findings. Not only does this serve as an advertisement for their product, but it also:
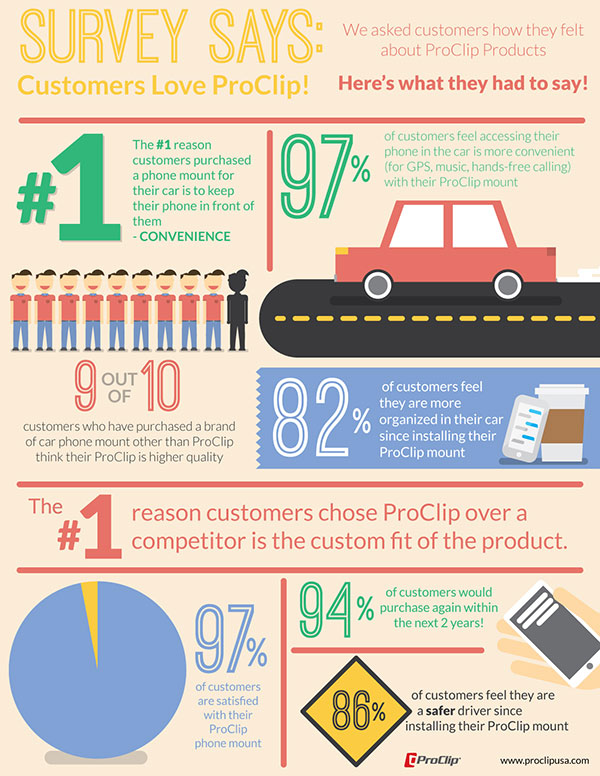
- Makes the customers polled feel like they made an impact
- Serves as an image that can be used in various materials (blogs, emails, promotional materials, etc.)
- Creates the perfect advertisement, whether just through social media shares or through intentional ad creation
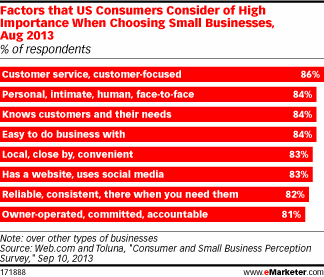
You can also poll your audience on customer service and use that information as training materials for your employees.
Not only does this show your customer base that you care enough to make changes, but it shows your employees that their actions have a direct effect on the business. All with one poll and one pretty visual!
Start Polling, Start Visualizing
Remember that polls can take many forms; you can collect data on a person-by-person basis, create an email survey, ask your followers on Twitter – whatever works for you and your bottom line. While not everyone in your customer base or contact list is going to respond, those that do will have valuable feedback. Your efforts in polling and acquiring feedback won’t go unnoticed either; potential customers and converts spend more time Googling the information you’ve put out there than you know!
Think about how many ways you could use your poll-collected data; you don’t have to just poll your audience and keep the data to yourself. Sharing your findings with your audience (and with potentially new audience members) can do absolute wonders! Start collecting data and use that information to the fullest.