Infographics are one of a few effective ways to get your message across in the field of education — from presenting lessons in the classroom to homework and essays to presenting data for your college research.
How to use infographics in the classroom
Here at Easelly, we have a bunch of different education infographic templates to fit any occasion.
Scroll down for some examples (turned into templates!) made by students and teachers alike.
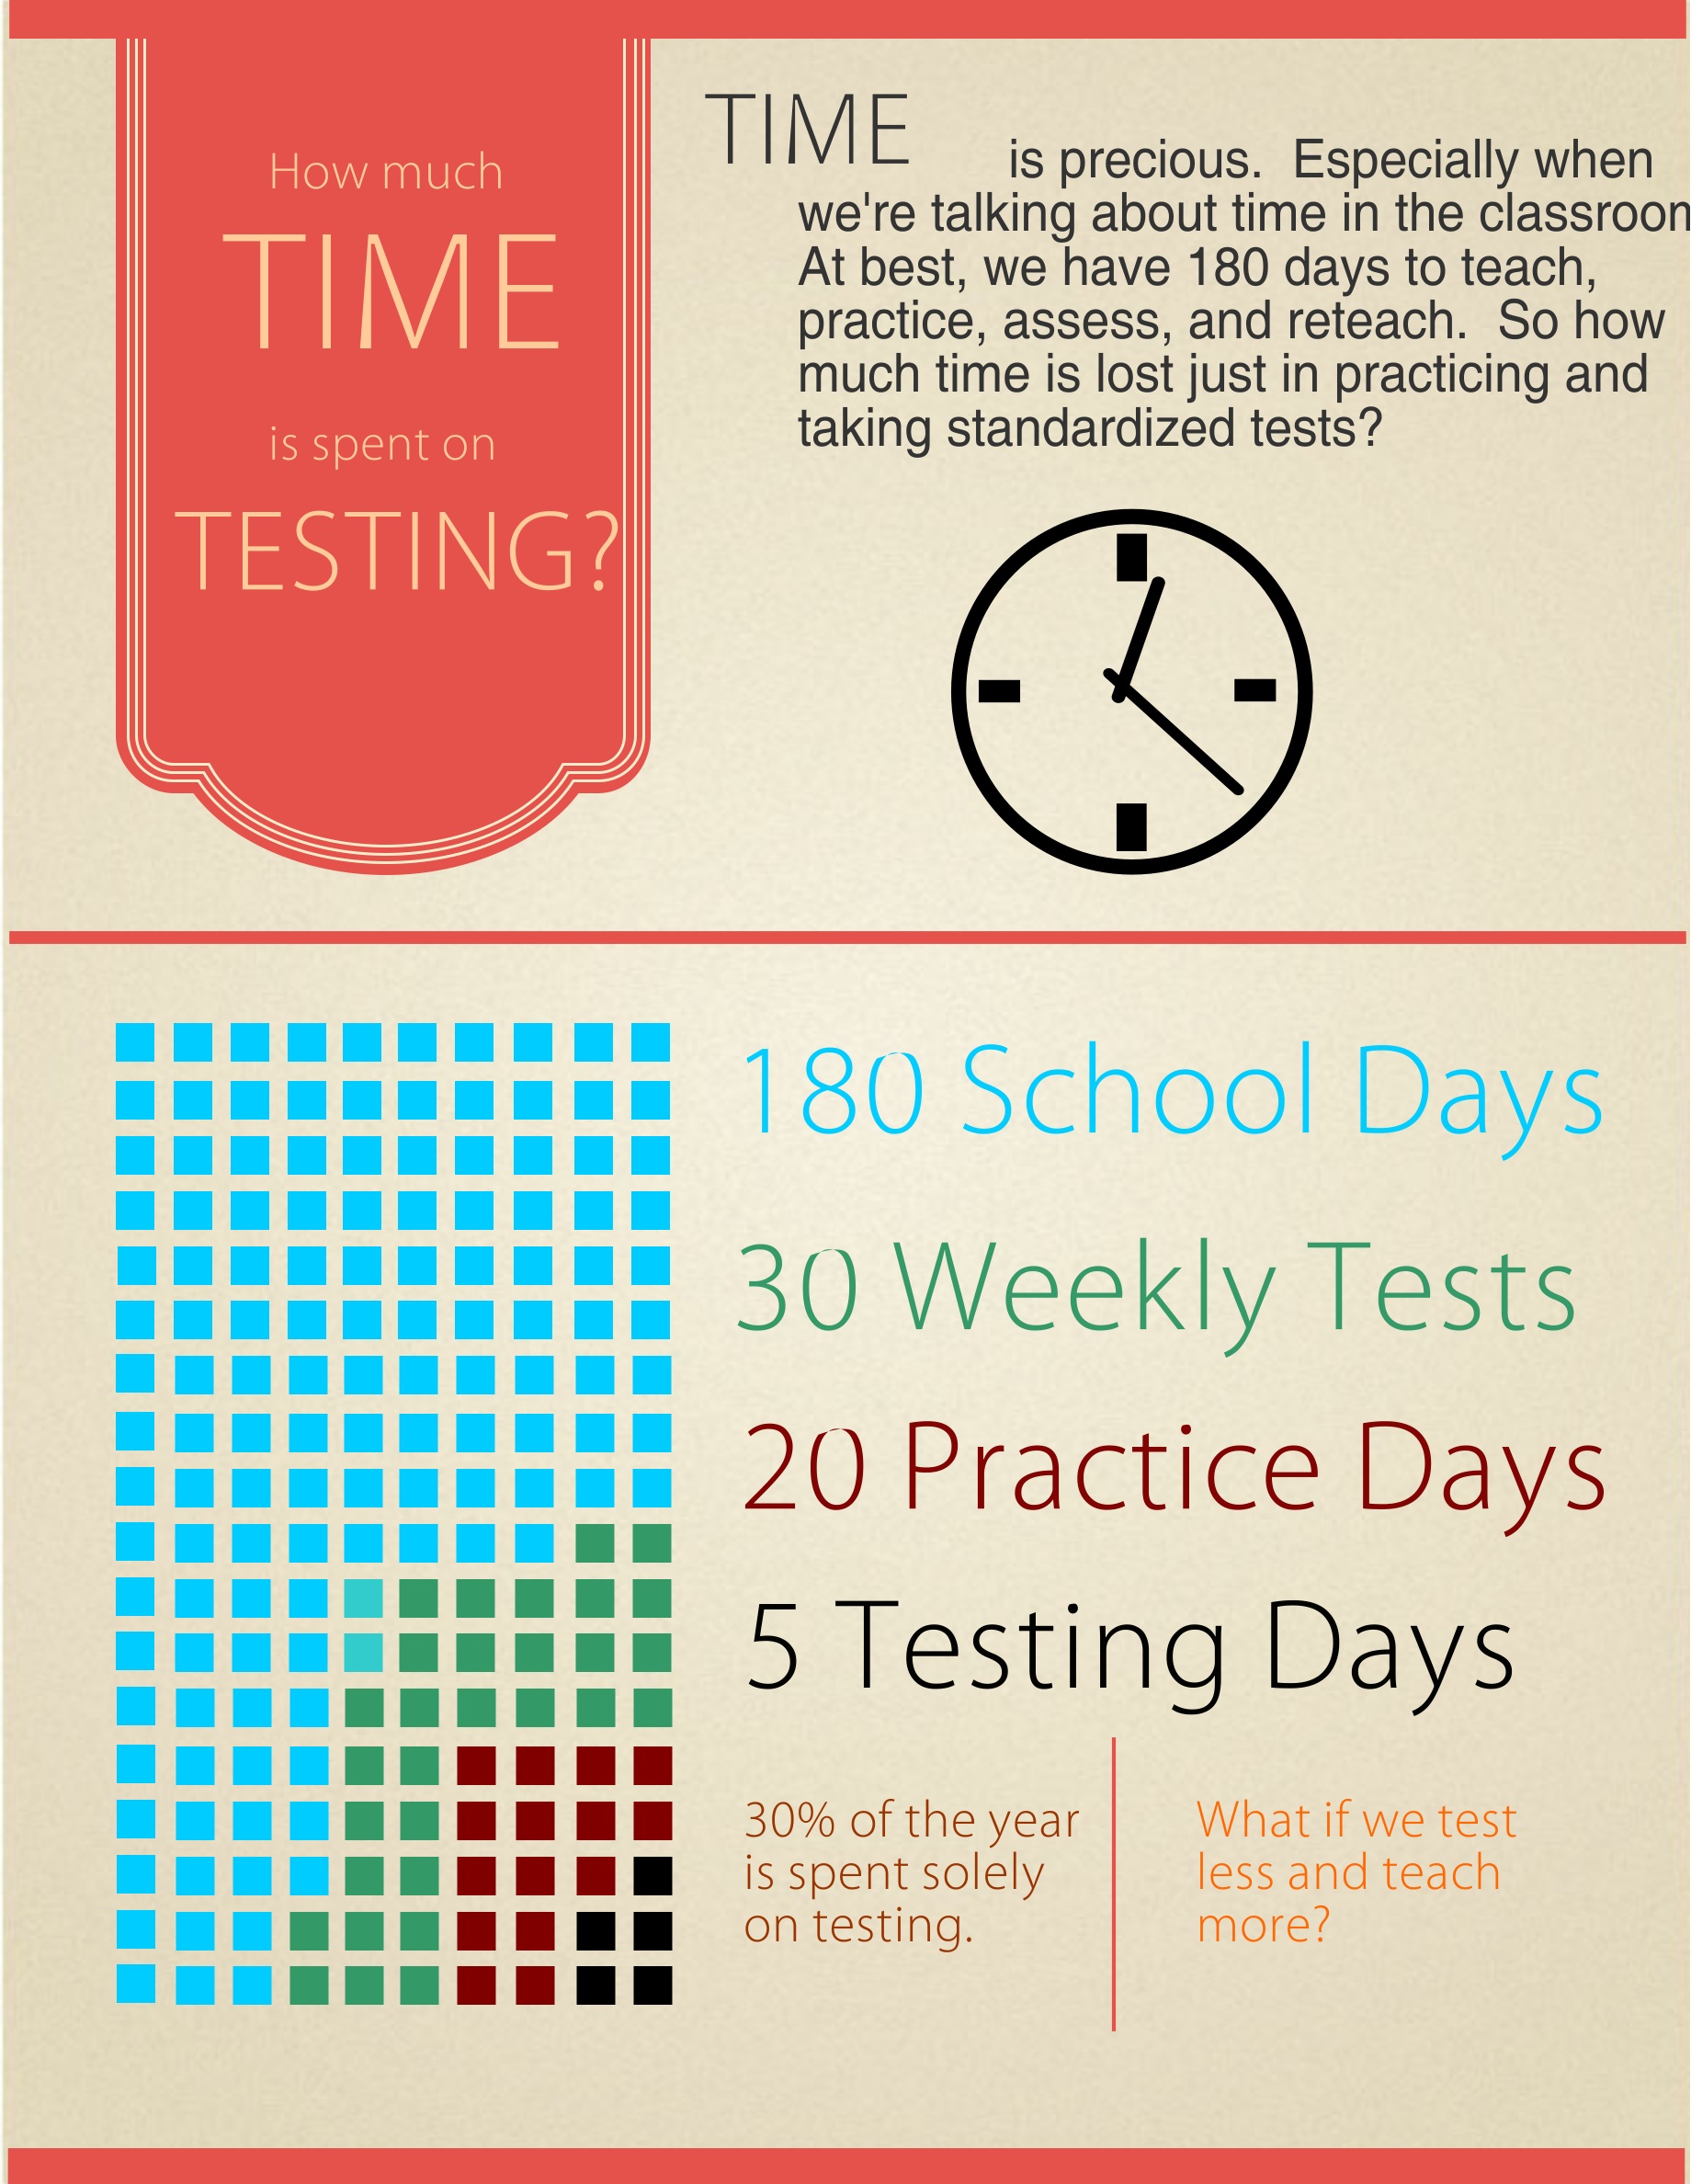
1. Visual learner characteristics
For a start, this infographic has a great background.
The warm color gives off a friendly feeling and having it as a gradient makes sure it isn’t just a dull field of pixels. It lays out its key points simply and also makes the text stand out nicely, with the black on the lighter side and a contrasting white on the other.
2. Hurricane categories

This infographic is ideal for next your lesson on hurricanes.
Accenting relations between segments by changing the shade of the basic color was a nice idea here. As a result, the viewers are more focused on the information, while the links are easy to follow. Having a motivational quote as the finish is a good way to make it more memorable.
3. GMO creation
This one is clean and minimal. Green and white are a nice contrast to the light blue background and the dark blue arrows keep them in balance.
The diagram here is simple and easy to remember, and the white text is a clever choice since it’s more visible against all the other colors and helps keep the minimalist vibe, adds Luella Cooke (Co-founder of Test Questions).
4. History of infographics
This timeline infographic is perfect for your history class. The flowchart gives it a consistent flow, the information is concise, and the segments’ colors are a perfect contrast to the neutral background. Also, the green dots add a sense of dynamics in this piece. Students will enjoy customizing this infographic with historical figures and information.
5. The importance of ecosystem
The colors blue and green go well together. This combination makes the infographic stand out as optimistic and friendly. Using black for emphasizing things to remember makes them look more serious and helps them stick to memory.
In addition, using pictograms within the infographic are a great way to highlight key points. You can’t go wrong with this template if you want a classroom visual that looks neat and clutter-free.
6. Types of bullying
Ideal for your civics class, this bullying infographic is another great example of using bold colors to highlight the important data points, and pairing illustrations with text to convey your message more effectively.
7. All about tigers
Graphs are a great way to present lots of data without drowning in clutter.
In this infographic, the data are presented well, and the colors highlight distinct differences without clashing with the background. Adding white dividers gives an impression of good organization, splitting up the info into smaller, digestible chunks.
8. How to spot fake news
Here’s a great example of how to be concise without skipping anything.
The main question stands out right away, and there’s a short explanation along with icons that’s a good association and can help people remember it. The brief answers are paired with attention-grabbing visualizations.
9. Music facts you probably don’t know about
This infographic has an excellent play of visual elements and it is an ideal template for creating a music tutorial such as how to use Garageband software on PC. Combining purple and yellow strikes a balance between playful and a serious tone. The color scheme is easy on the eye, and the dots acting as dividers make the infographic look more organized.
Recommended reading – 7 Quick Tips in Picking the Perfect Color Combination for Your Infographics
10. How to help kids learn better
Video tutorials to help you make better infographics for education
Taking advantage of visual learning and using modern technology by using infographics in the classroom yield better results than just hunching over a plain old textbook. Infographics can also be a huge boost to distance learning.
The following video tutorials are good starting points to help you make infographics for school.
How to customize infographic templates using Easelly
5 infographic activities with students + templates
How to use timeline infographics + templates
5 process infographic tips + templates
How to improve your infographic in 5 easy steps
We hope both teachers and students continue to have fun and learn new things by trying out infographics today!
You can find many other infographic templates with Easelly’s infographic maker tool.
Recommended resources:
- Free infographic activity book for students
- How Infographics Can Be Used for Any Classroom Subject
- 10 Tips to Jazz Up Your Science Classroom with Infographics
*Editor’s Note: This blog post was updated on December 8, 2020 for accuracy and comprehensiveness. It was originally published on November 4, 2015